

Tuesday October 4, 2016 3:00pm Pacific
DOW – 85 on 1300 net declines
NASDAQ COMP – 11 on 600 net declines
SHORT TERM TREND Bullish
INTERMEDIATE TERM TREND Bullish
STOCKS: British P.M. Theresa May stated that there would be a hard date set for exiting the EU. That collapsed the pound and caused a dollar surge.
This in turn caused bonds and gold to drop sharply and the stock market followed suit.
There was also a rumor that the ECB would taper its efforts to provide stimulus and a Cleveland Fed President Loretta Mester called for higher rates.
I’m guessing that a Fed official may appear on Wednesday and call for rates to stay the same. When they cause a market decline, there is a tendency for an opposite view the next day.
GOLD: Gold was hit because of a rise in rates and a dollar surge.
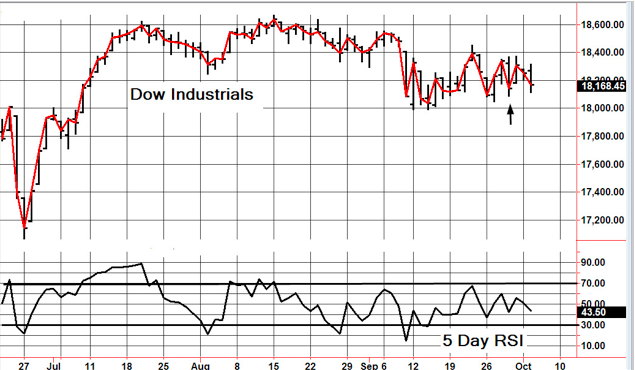
CHART: The Dow held a previous low (arrow). I think that there is a good chance that it will rebound on Wednesday.
BOTTOM LINE: (Trading)
Our intermediate term system is on a buy.
System 7 Let’s do a scalp. Buy the SSO at the opening and remain with it for the session.
System 8 We are in cash. Stay there.
News and fundamentals: There were no important economic releases on Tuesday. On Wednesday we get the ADP employment report, the oil inventory report and the trade deficit.
Interesting Stuff: When you are courting a nice girl an hour seems like a second. When you sit on a red-hot cinder a second seems like an hour. That’s relativity.———- Albert Einstein
TORONTO EXCHANGE: Toronto lost 37.
BONDS: Bonds were sharply lower.
THE REST: The dollar was much higher. Silver was lower and crude oil moved higher again.
Bonds –Change to bearish as of today Oct. 4.
U.S. dollar -Bullish as of August 30.
Euro — Bearish as of August 30.
Gold —-Change to bearish as of today Oct. 4.
Silver—- Change to bearish as of today Oct. 4.
Crude oil —- Bullish as of August 3.
Toronto Stock Exchange—- Bullish from January 22.
We are on a long term buy signal for the markets of the U.S., Canada, Britain, Germany and France.
…also: Monthly Charts Argue for Lower Prices in Precious Metals Complex
|
|
Tue. |
Wed. |
Thu. |
Fri. |
Mon. |
Tue. |
Evaluation |
|
Monetary conditions |
0 |
0 |
0 |
0 |
0 |
0 |
0 |
|
5 day RSI S&P 500 |
54 |
62 |
45 |
57 |
51 |
43 |
0 |
|
5 day RSI NASDAQ |
60 |
63 |
46 |
58 |
54 |
50 |
0 |
|
McCl- lAN OSC. |
-11 |
+50 |
-52 |
+10 |
-22 |
-91 |
0
|
|
Composite Gauge |
8 |
5 |
14 |
7 |
11 |
12 |
0 |
|
Comp. Gauge, 5 day m.a. |
9.8 |
9.8 |
11.4 |
10.0 |
9.0 |
9.8 |
0 |
|
CBOE Put Call Ratio |
.98 |
.92 |
1.03 |
1.01 |
1.04 |
.90 |
0 |
|
VIX |
13.10 |
12.39 |
14.02 |
13.29 |
13.5 |
13.63 |
|
|
VIX % change |
-10 |
-5 |
+13 |
-5 |
+2 |
0 |
0 |
|
VIX % change 5 day m.a. |
-3.2 |
-1.0 |
+3.6 |
+2.2 |
-1.0 |
+1.0 |
0 |
|
Adv – Dec 3 day m.a. |
-613 |
+159 |
+30 |
+264 |
-332 |
-185 |
0 |
|
Supply Demand 5 day m.a. |
.54 |
.55 |
.45 |
.56 |
.68 |
.55 |
0 |
|
Trading Index (TRIN) |
1.12 |
.63 |
.74 |
.80 |
1.07 |
.92 |
0
|
|
S&P 500
|
2160 |
2171 |
2151 |
2168 |
2161 |
2150 |
Plurality 0 |
INDICATOR PARAMETERS
Monetary conditions (+2 means the Fed is actively dropping rates; +1 means a bias toward easing. 0 means neutral, -1 means a bias toward tightening, -2 means actively raising rates). RSI (30 or below is oversold, 80 or above is overbought). McClellan Oscillator ( minus 100 is oversold. Plus 100 is overbought). Composite Gauge (5 or below is negative, 13 or above is positive). Composite Gauge five day m.a. (8.0 or below is overbought. 13.0 or above is oversold). CBOE Put Call Ratio ( .80 or below is a negative. 1.00 or above is a positive). Volatility Index, VIX (low teens bearish, high twenties bullish), VIX % single day change. + 5 or greater bullish. -5 or less, bearish. VIX % change 5 day m.a. +3.0 or above bullish, -3.0 or below, bearish. Advances minus declines three day m.a.( +500 is bearish. – 500 is bullish). Supply Demand 5 day m.a. (.45 or below is a positive. .80 or above is a negative). Trading Index (TRIN) 1.40 or above bullish. No level for bearish.
No guarantees are made. Traders can and do lose money. The publisher may take positions in recommended securities.St


