
![]()
![]()
Changing fundamentals and emotion each cause price change, this week’s Market Minutes discusses how to tell the difference and make money from these changes. You can watch this week’s video on Youtube by clicking here. To receive email alerts any time I upload a new video, subscribe to the Stockscores channel atwww.youtube.com/stockscoresdotcom.
I wrote a new book over the summer, it will be available in a pre-release version to Stockscores subscribers before the end of the year. Over the next few weeks I will share excerpts from the book, The Mindless Investor – Make Money in the Market by Overcoming Your Common Sense. Here is an excerpt from the chapter, Channel Surfing.
The majority of strong price trends will begin with abnormal price action. A catalyst for a positive shift in the market’s perception of fundamentals ignites buyer interest and starts the stock higher. As the trend develops, improving fundamentals and the law of upticks help the trend to continue moving from the lower left to the upper right of the chart. An uptrend is in place.
It’s inevitable that the upward move will see pullbacks against the trend. There will be shareholders who want to take profits as the stock’s price climbs, and this causes shorter downward moves inside the upward trend. There is an increased chance of these pullbacks early in the trend because investors tend to doubt strength when it’s just getting started. As the trend progresses, stock owners grow more confident, believing that the upward climb legitimizes the company’s story.
The pullbacks are healthy. They work to shake out weak owners and build a more solid base of shareowners who will be committed to holding the stock. It’s the pullbacks that allow us to buy strong companies when they are on sale-the one time it makes sense to buy weakness.
Defining a Trend
To take advantage of the opportunity that trends provide requires the ability to define the trend. This is as simple as drawing a line across at least two inflection points in the trend. Typically, the first is the low before the trend starts, and the second is the low of the first pullback. Once defined, it is quite remarkable how well trend lines act as support and resistance for a stock.
There is a bit of an art to defining a trend line. You begin by highlighting the inflection points and then look for a line that best fits as many of those inflection points as possible. For an upward trend, the focus is on the inflection point lows, which will be rising over time. Downward trends will have a line that cuts across the inflection point tops as they fall from left to right.
Price trends usually develop as a company goes through a period of improving fundamentals. This is what carries the general rise higher in the stock, allowing it to outperform the overall market. In upward trends the tendency is for stocks to run away from their trend line and then come back to them. These fluctuations are primarily attributed to emotion. As investors feel greed and excitement about the improving fundamentals, they chase the stock higher, causing it to go up too fast. At some point, the sellers step in and limit the enthusiasm of the buyers by acting with strength, causing the stock to pull back through a round of profit-taking.
These pullbacks are shorter than the trend that came into them, allowing the stock to maintain its cycle of rising bottoms. It’s the pullbacks, and the resulting rising bottoms, that define the trend line. As chart watchers, we just have to pick out the lows of the rising bottoms and connect the dots, drawing a straight line that best fits the trend.
![]()
I did a custom scan this week to look for Canadian stocks that have potential. I set the Market Scan up to seek stocks breaking through 5 day resistance, up at least 2% and trading at least 500 times. That found 33 stocks. Here are stocks that have charts showing early signs of an imminent upward trend:
![]()
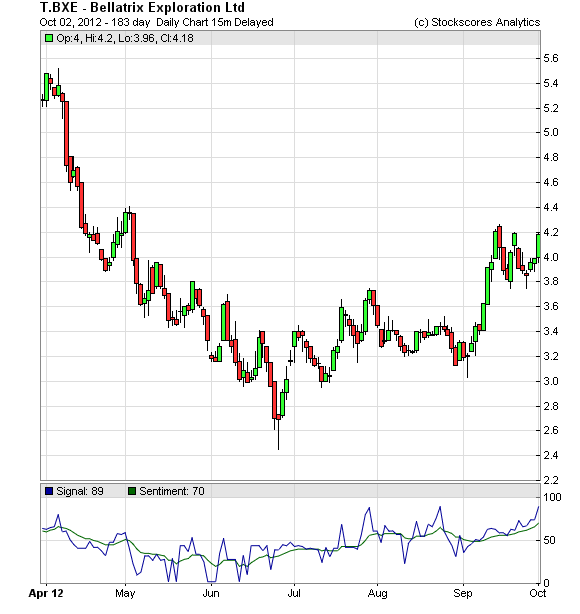
1. T.BXE
T.BXE started to move higher early in September and then trended sideway for the rest of the month. Today it started to move up again and traded higher than normal volume. Should continue higher so long as it can hold above support at $3.80.
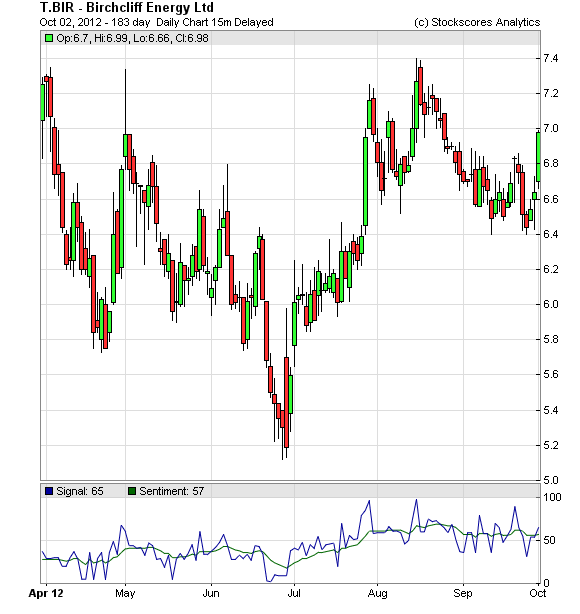
2. T.BIR
T.BIR has been on my feature list for my daily newsletter for some time after it showed good signs late in July. Since then, it has been a sleeper but it came alive again today, moving up through a downward trend line and trading with higher than expected volume. Support now at $6.40.
Reminder: Tyler Bullhorn will appear in Calgary on Monday evening, October, 29 and Tuesday evening, Oct. 30 in Vancouver in an exclusive seminar that will teach you the essential techniques of when to buy and when to sell in order to achieve greater profits. For more information click on EVENTS on the Money Talks home page.
Thanks Mike
References
- Get the Stockscore on any of over 20,000 North American stocks.
- Background on the theories used by Stockscores.
- Strategies that can help you find new opportunities.
- Scan the market using extensive filter criteria.
- Build a portfolio of stocks and view a slide show of their charts.
- See which sectors are leading the market, and their components.
Disclaimer
This is not an investment advisory, and should not be used to make investment decisions. Information in Stockscores Perspectives is often opinionated and should be considered for information purposes only. No stock exchange anywhere has approved or disapproved of the information contained herein. There is no express or implied solicitation to buy or sell securities. The writers and editors of Perspectives may have positions in the stocks discussed above and may trade in the stocks mentioned. Don’t consider buying or selling any stock without conducting your own due diligence.


