

Something happened last week that few retail investors noticed.
And it should wake up misinformed bulls.
Take a look at the following chart of the benchmark 10 Year Treasury bond:
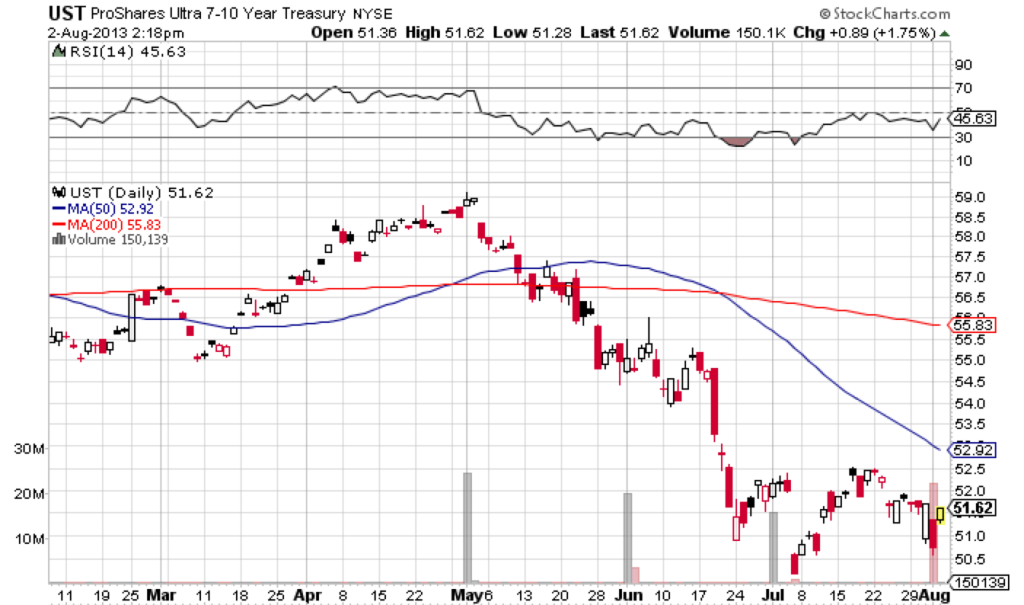
In the last few months, the 10-year bond price has continued to fall. Now take a look at this:
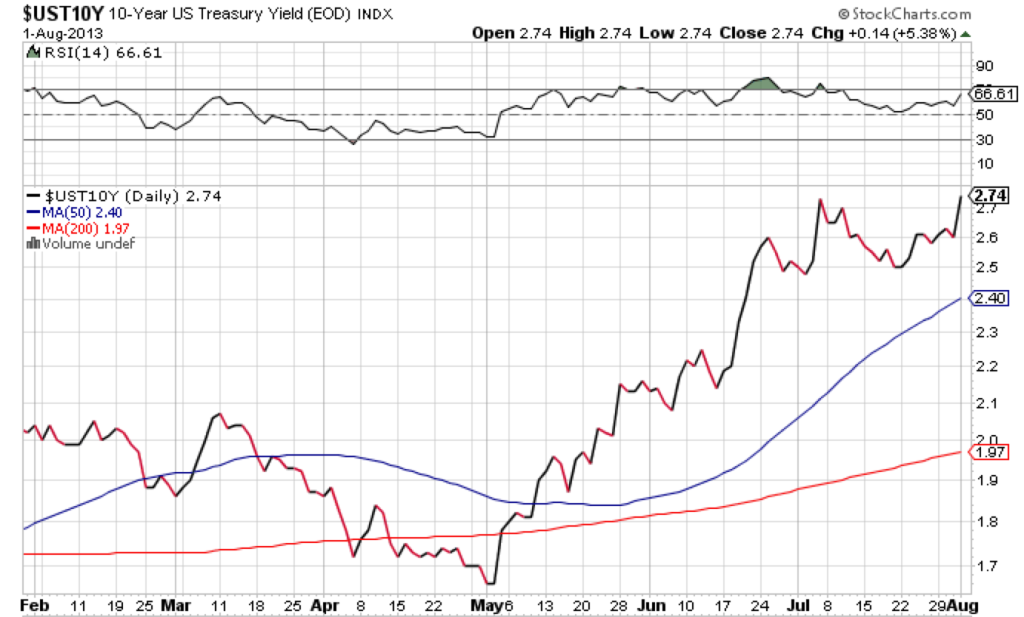
The yield on the benchmark 10 Year Treasury bond has now shot passed 2.7% – a dramatic rise of 1% in less than 3 months.
If this trend continues, it could be the tipping point that pops the stock market bubble.
Let me explain.
The 10 Year US Treasury yield is the benchmark indicator – not just for the U.S., but also for the rest of the world.
The higher the yield on the 10-year, the higher the interest rates worldwide.
And in the last few months, this number has soared more than 60% – its greatest percentage move since 1962.
Higher interest rates makes housing less affordable and among other things, will slow GDP growth. Given that the housing sector is already being affected, as noted by the continued decline of mortgage applications, the 10-year yield continues to prove itself as a consistent indicator.
The decline in mortgage applications clearly indicates the effect of the 10-year yield. Mortgage rates in the U.S. have already jumped from 3.4% in early May to 4.4% today. When the 10-year yield goes up, so do mortgage rates.
And the drastic decline in mortgage applications follows.
Not only do rising rates cause a major slowdown to economic growth – especially during a time when growth is needed – they can have an adverse effect on the financial markets.
Ed Note: Read more about:


