

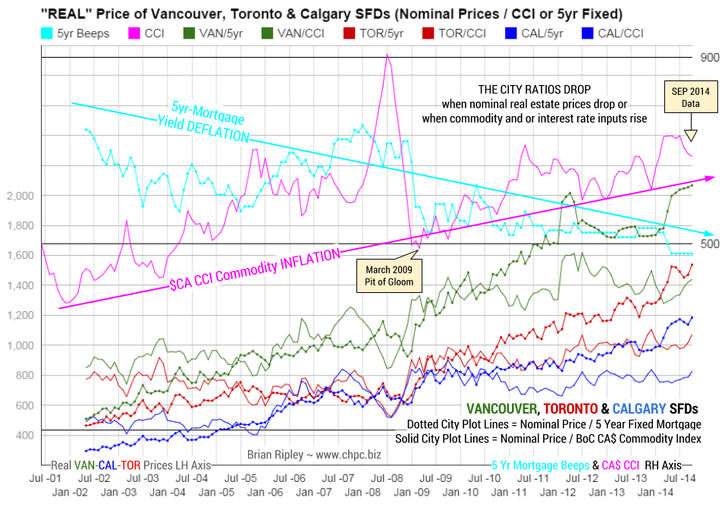
The chart above shows the “real price” of Vancouver, Toronto & Calgary SFDs when looked at from the point of view of the BoC Canadian Commodity Index (CCI) and Borrowing Costs (5yr Mortgage) which are the main input costs apart from operating expenses and tax.
In September 2014 the CCI (solid pink line) continued dropping after a failed breakout above the previous major high set in April 2011. The cost of stuff is still keeping the “real” price of SFDs (solid city lines) well below the Spring 2012 highs, but the gap is closing.
The other major cost input, the retail 5 year fixed mortgage rate (aqua dotted line) remained at the April 2014 record low of 4.79% or 35 bps below the previous 5.14% low of July 2013.
Neighborhood banks are advertising sub 3% five year fixed mortgages. Hello Japan. The fire sale mortgage rates are allowing the real cost of housing (city dotted lines) to continue floating up to new monthly and historical highs.
…related:
TSX Energy, Real Estate, Financial Services, Gold and the Bank of Canada Commodities Indexes


