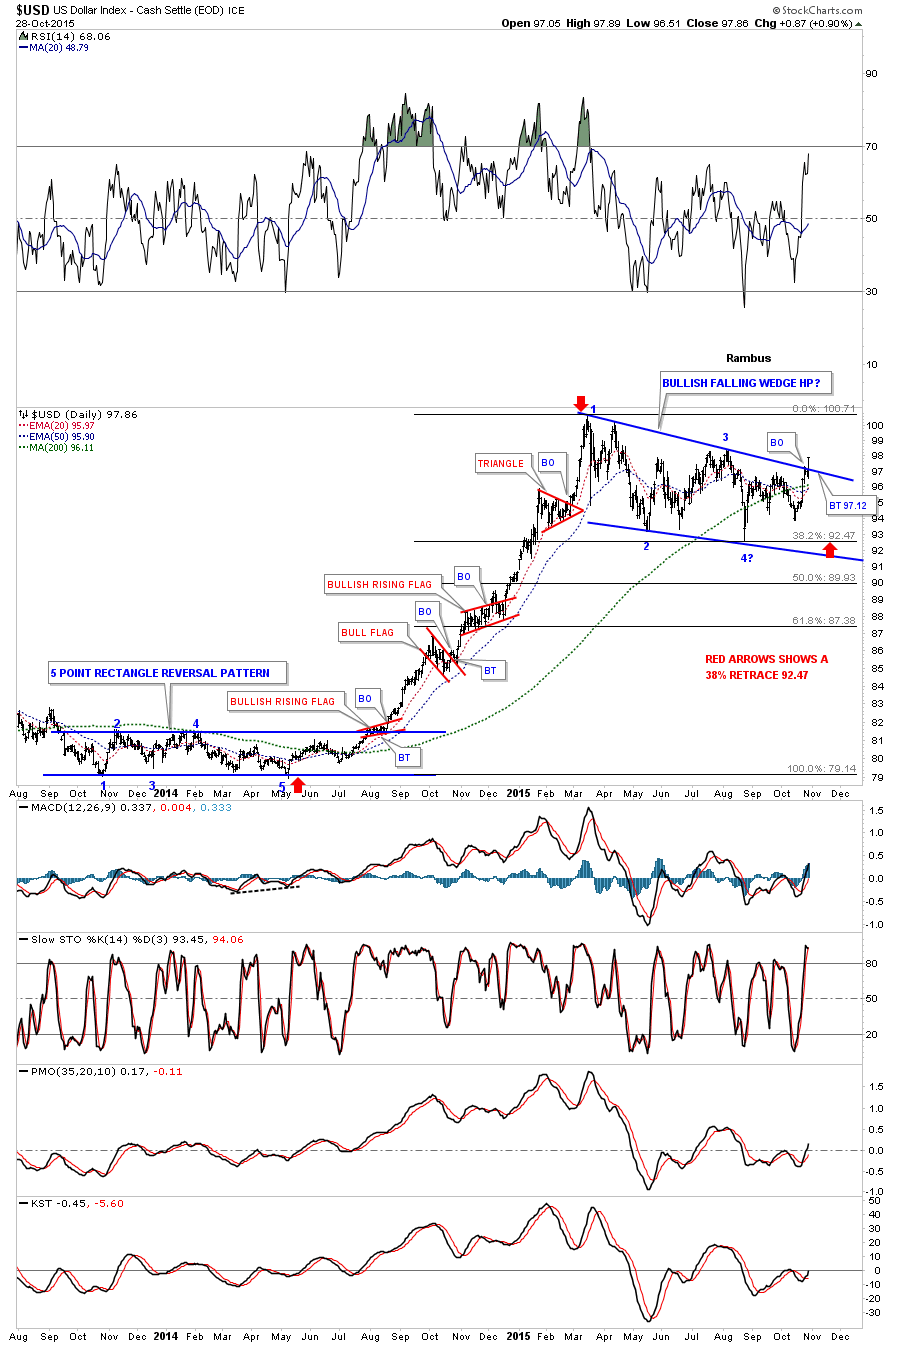
It finally looks like a major inflection point is getting very close to resolving itself in many different areas of the markets. The US dollar is the key driver of this inflection point which is starting to breakout from a nearly eight month bullish falling wedge consolidation pattern. This afternoon the US dollar began a strong rally that is somewhat unusual during the afternoon hours unless it is Fed Day where anything goes . The daily chart below now shows today’s bar clearly above the top rail of the bullish falling wedge. It’s still possible that we could see a backtest to the top rail at 97.12 before the next impulse move up begins in earnest.
There are some positive developments in regards to the US dollar on the daily chart below. First there are four completed reversal points in the blue bullish falling wedge. This eight month consolidation pattern corrected 38% of the first big impulse leg up as shown by the red arrows. The 20 day ema has just recently crossed above the 50 day ema giving a buy signal. The US dollar is now trading well above its 200 dma which shows the long term nature of this bull market.
…..click HERE or the chart below for much bigger charts and a comprehensive analysis – Editor Money Talks
…..click HERE or the chart above for much bigger charts and a comprehensive analysis – Editor Money Talks