

Tech Talk clearly did not anticipate the surge in equity markets on Friday. Breakouts by key equity indices to all-time highs (and the appropriate media attention) likely will lead to further short term gains. However, a lack of favourable seasonal influences, mixed responses to quarterly reports, economic data suggesting a slow-down in growth, increasing concerns about a slowdown in U.S. monetary stimulus and virtually no progress on U.S. fiscal policy suggest that short term strength will provide an opportunity to take additional seasonal profits.
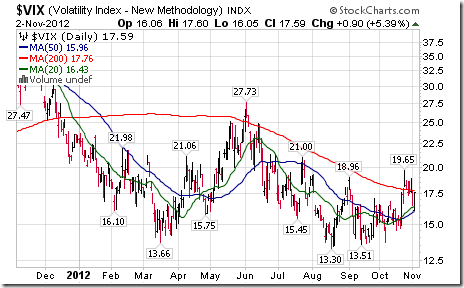
The VIX Index dropped 0.76 (5.58%) last week. The Index also fell below its 20 and 50 day moving averages.
The frequency of first quarter reports by S&P 500 companies has started to wind down. Responses have been consistent. When earnings and revenues significantly exceeded consensus, stock prices rose sharply. When earnings and revenues were in line or less than consensus, stock prices moved lower. First quarter reports by top Canadian companies peak this week.
Economic data this week is not expected to have a significant impact on equity markets.
Equity markets responded surprisingly strong on Friday to the U.S. employment report. The data for the most part was better than expected, but was significantly less than robust. Impact on the bond market was greater than impact on equity markets. Bond prices dropped sharply in anticipation of a possible earlier-than-expected withdrawal of monetary stimulus.
Short term technical indicators turned sharply positive on Friday on a wide variety of equity markets and sectors. Strength related to breakouts to all-time highs by the S&P 500 Index and Dow Jones Industrial Average on Friday are likely to extend into trading early this week.
Medium term technical indicators remain significantly overbought implying that early strength in equity markets and sectors this week is unlikely to be sustained.
International news could influence equity markets. Focuses are on the Bank of England’s rate decision on Thursday, the Eurozone’s Purchasing Manager’s Index today and escalating developments in Syria following Israel’s incursion late on Friday.
Large cash positions held by major U.S. and Canadian corporations increasingly are being employed in dividend hikes and share buy backs instead of building additional capacity.
Favourable seasonal influences in most equity markets around the world and in economically sensitive of sectors have a history of peaking around this time of year.
Equity Trends
The S&P 500 Index gained32.18 points (2.03%) last week. Intermediate uptrend was confirmed on a move above 1,597.35. to an all-time high. The Index remains above its 20, 50 and 200 day moving averages. Short term momentum indicators are overbought.

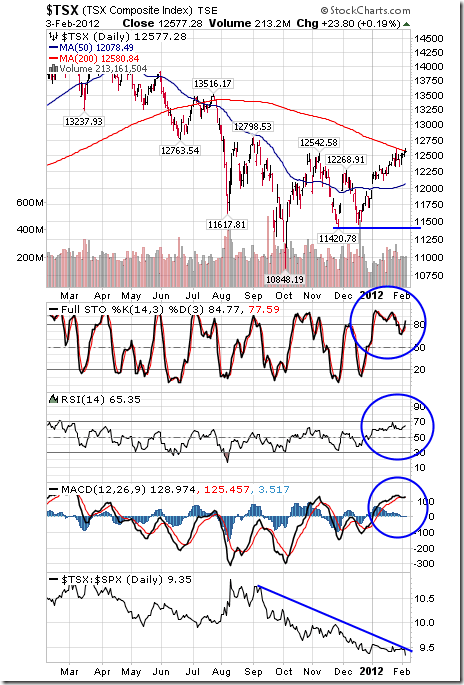
The TSX Composite Index gained 217.83 points (1.78%) last week. Trend remains down. The Index moved above is 20 and 50 day moving averages last week. Strength relative to the S&P 500 Index remains negative, but showing early signs of change. Technical score based on the above indicators improved from 0.0 to 1.0. Short term momentum indicators are trending up.
The NASDAQ Composite Index gained 99.37 points (3.03%) last week. Intermediate uptrend was confirmed on a move above 3,306.95 to a 12 year high. The Index remains above its 20, 50 and 200 day moving averages. Strength relative to the S&P 500 Index improved from neutral to positive. Technical score based on the above indicators improved from 2.5 to 3.0. Short term momentum indicators remain overbought.

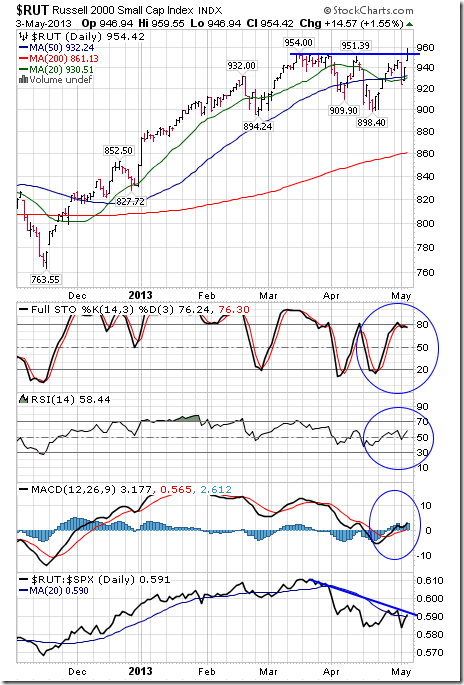
The Russell 2000 Index added 19.17 points (2.05%) last week. Trend changed from down to up on a move above 954.00 on Friday. The Index remains above its 20, 50 and 200 day moving averages. Strength relative to the S&P 500 Index remains neutral. Technical score based on the above indicators increased from 1.5 to 2.5. Short term momentum indicators are overbought.
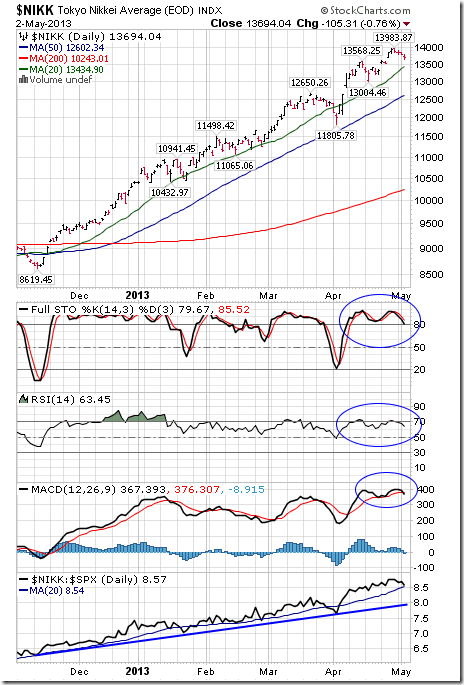
The Nikkei Average fell 190.09 points (1.37%) last week. Intermediate trend remains up. The Average remains above its 20, 50 and 200 day moving averages. Strength relative to the S&P 500 Index remains positive. Technical score based on the above indicators remains at 3.0. Short term momentum indicators are overbought and showing early signs of rolling over.
…..view 47 other charts & analysis HERE


