

Now is a time for caution in equity market. Special situations are available as indicated below. A healthy weight in cash and cash equivalents makes sense between now and the end of September.
July Consumer Prices to be released at 8:30 AM EDT on Tuesday are expected to increase 0.1% versus a gain of 0.3% in June.Excluding food and energy, July CPI is expected to increase 0.1% versus a gain of 0.1% in June.
July Housing Starts to be released at 8:30 AM EDT on Tuesday are expected to increase to 964,000 from 893,000 in June.
FOMC Meeting Minutes from the July 30th meeting are expected to be released at 2:00 PM EDT on Wednesday
Initial Weekly Jobless Claims to be released at 8:30 AM EDT on Thursday are expected to fall to 308,000 from 311,000 last week.
July Existing Home Sales to be released at 8:30 AM EDT on Friday are expected to slip to 5.00 million units from 5.04 million units in June.
Canadian June Retail Sales to be released at 8:30 AM EDT on Friday are expected to increase 0.4% versus a gain of 0.7% in May.
Canadian July Consumer Prices are expected to slip 0.1% versus a gain of 0.1% in June.
August Philadelphia Fed to be released at 10:00 AM EDT on Friday is expected to fall to 15.5 from 23.9 in July.
July Leading Economic Indicators to be released at 10:00 AM EDT on Friday are expected to increase 0.7% versus a gain of 0.3% in June.
Summary of Weekly Seasonal/Technical Parameters for Equity Indices/ETFs
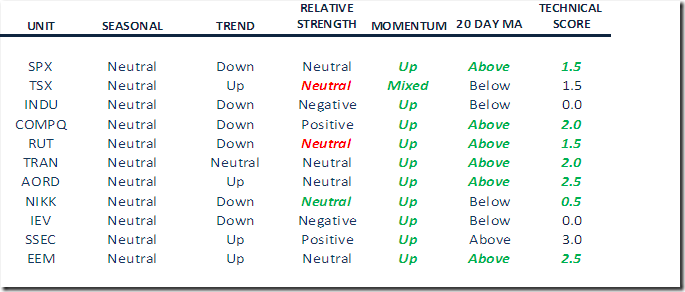
Key:
Seasonal: Positive, Negative or Neutral on a relative basis applying EquityClock.com charts
Trend: Up, Down or Neutral
Strength relative to the S&P 500 Index: Positive, Negative or Neutral
Momentum based on an average of Stochastics, RSI and MACD: Up, Down or Mixed
Twenty Day Moving Average: Above, Below
Green: Upgrade or higher
Red: Downgrade or lower
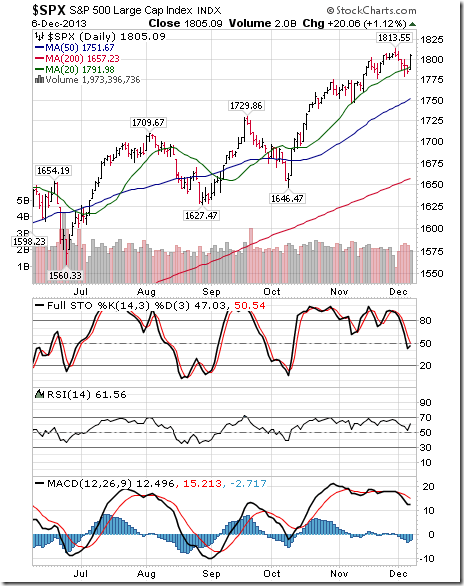
The S&P 500 Index gained 23.47 points (1.22%) last week. Intermediate trend remains down. The Index moved above its 20 day moving average. Short term momentum indicators are trending up. Note that the Index recovered to its breakdown level where resistance was encountered.
…..go HERE and scroll down for Don’s analysis of the TSE & 45 other indices and charts including seasonality


