

The Bottom Line
Technical action by equity markets was a negative surprise. Furthermore, short term technical action has yet to show signs of bottoming and weak economic news this week attributed to Hurricane Sandy will not help. Preferred strategy is to accumulate equities and Exchange Traded Funds with favourable seasonality at this time of year that already are showing technical signs of performance or outperformance relative to the market (S&P 500 Index for U.S. markets or TSX Composite Index for Canadian markets). Sectors include agriculture, forest products, transportation, industrials, mines & metals, home builders, semiconductors, China and Europe.
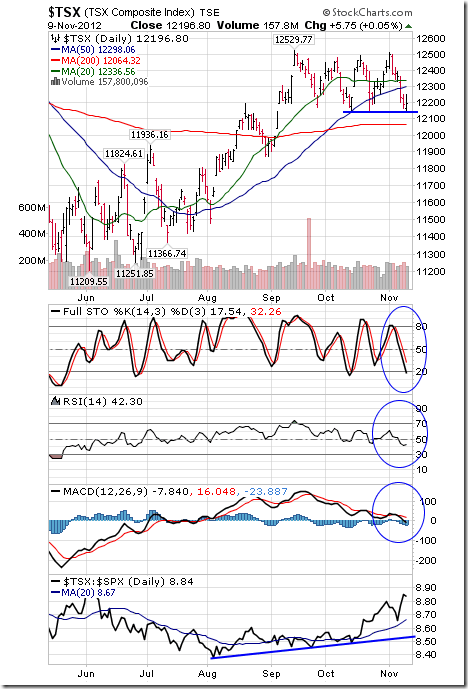
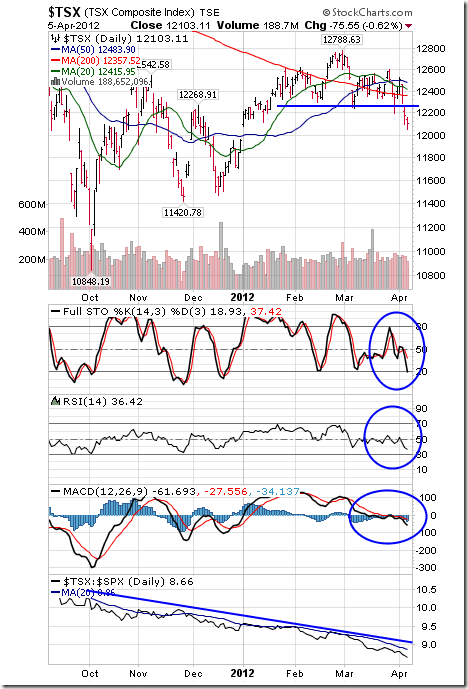
The TSX Composite Index fell 183.61 points (1.48%) last week. Intermediate trend is neutral. Support is at 12,137.18 set on October 15th. Resistance is at 12,529.77. The Index remains above its 200 day moving average and below its 20 and 50 day moving averages. Short term momentum indicators are trending down, but have yet to show signs of bottoming. Strength relative to the S&P 500 Index remains positive.
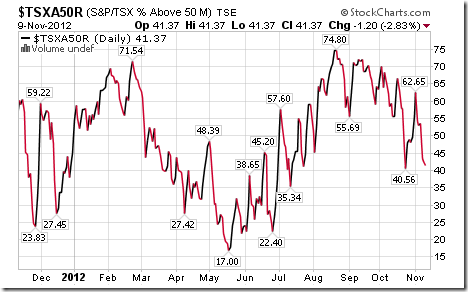
Percent of TSX Composite stocks trading above their 50 day moving average fell last week to 41.37% from 54.22%. Percent is in an intermediate downtrend.
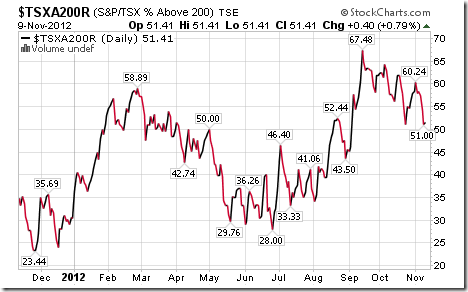
Percent of TSX Composite stocks trading above their 200 day moving average fell last week to 51.41% from 57.83%. Percent is in an intermediate downtrend.
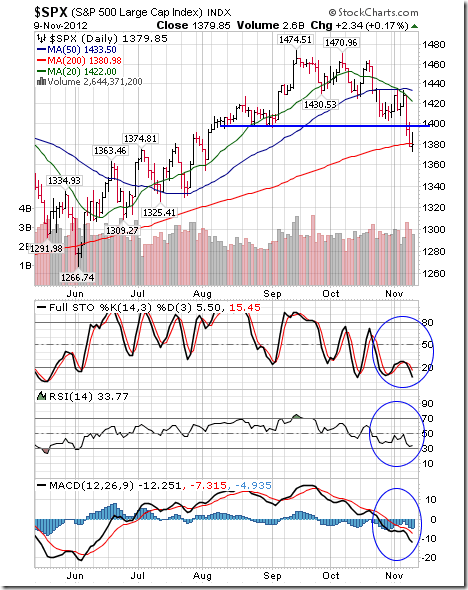
The S&P 500 Index fell 34.35 points (2.43%) last week. Intermediate trend is down. Support at 1,396.56 was broken on Wednesday. The Index remains below its 20 and 50 day moving averages and closed at its 200 day moving average on Friday. Short term momentum indicators are oversold, but have yet to show signs of bottoming.
Percent of S&P 500 stocks trading above their 50 day moving average dropped last week to 31.60% from 49.60%. Percent continues an intermediate downtrend.

Percent of S&P 500 stocks trading above their 200 day moving average dropped last week to 55.40% from 65.20%. Percent continues an intermediate downtrend.
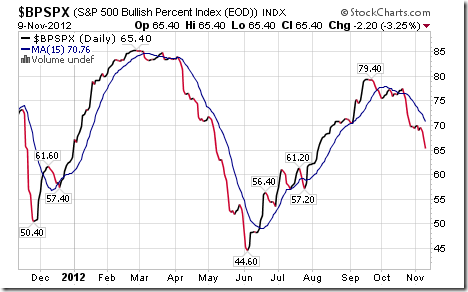
Bullish Percent Index for S&P 500 stocks fell last week to 65.40% from 70.20% and remains below its 15 day moving average. The Index remains in an intermediate downtrend.
 …
…
……….view the other 45 Major Stock Index, Gold, Currency, & Commodity Charts & Commentary HERE
Go to the top of this page HERE for a list of this weeks upcoming Economic News


