

The Toronto stock market racked up a solid advance Monday amid rising metal prices, while traders looked to the kickoff of the second-quarter earnings season in the U.S. with results from resource giant Alcoa Inc.
The S&P/TSX composite index advanced 73.96 points to 12,208.87.
….for all action in markets today go HERE
The 30-second technical flash chart report on S&P 500
U.S. equities opened higher this morning and are setting up for a sharp pullback based on technical analysis using trends, cycles, momentum, volume, market breadth and key resistance zones.
Take a look at the charts below for a quick flash of what I think.
Barchart Market Momentum Index
This chart I look at daily. In short if its price is at 101 or higher I expect the broad market to pause or pullback within the next day. It tells me if stocks have moved too far in one direction on a daily basis and if so sellers (big money players) are likely to re-align stocks by taking profits or shorting during these times.
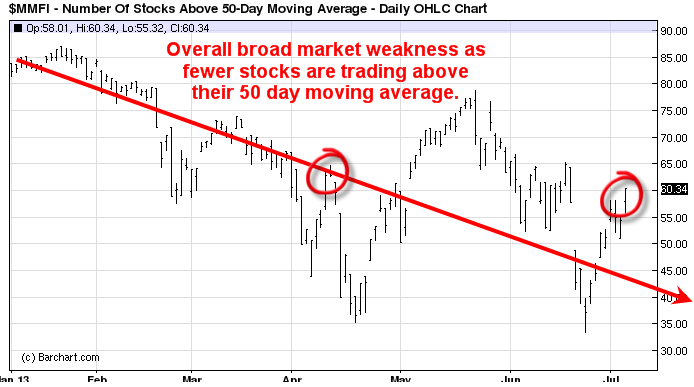
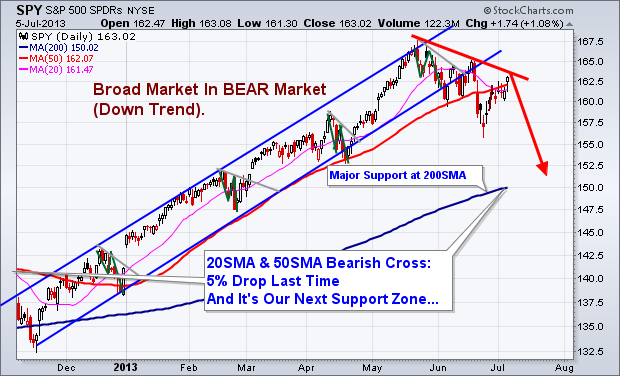
Stock Trading Above the 50-Day Moving Average
Here we can see that while the S&P 500 has been rising over the past six months, fewer stocks are trading above their 50-day moving average. This means a smaller group of stocks is holding the market up and it’s just a matter of time before those stocks burn out and roll over also.
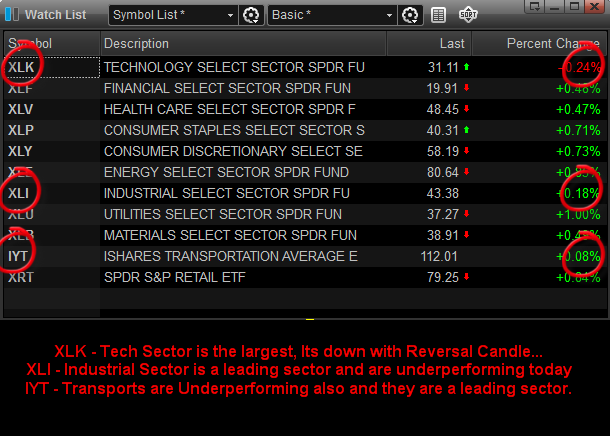
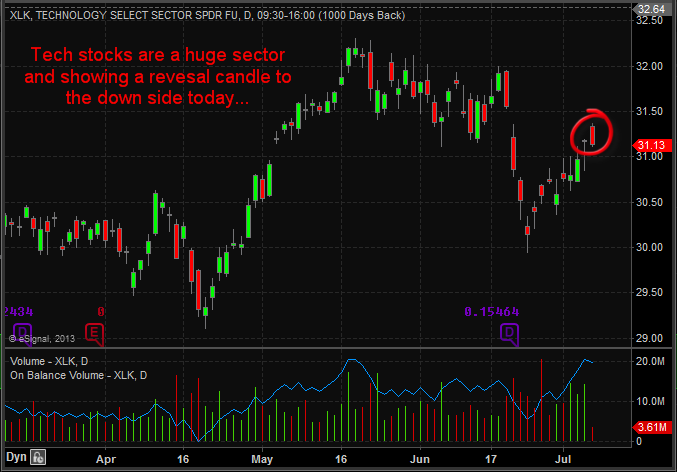
Key Sectors That Move & Lead the Market
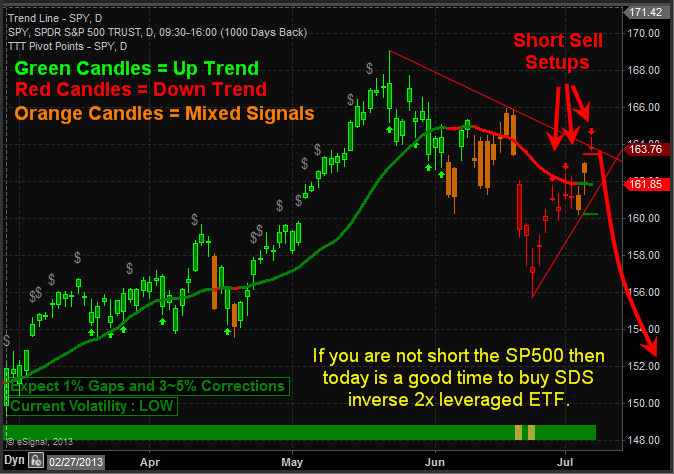
SPY Swing Trading Analysis – Daily Chart
With the S&P 500 breaking down from its trend channel and testing a short term resistance trend line, odds favor sellers should become more active and pull the market down as they unload any remaining long positions and possibly get short the market. Both of these actions will put pressure on U.S. Stocks.
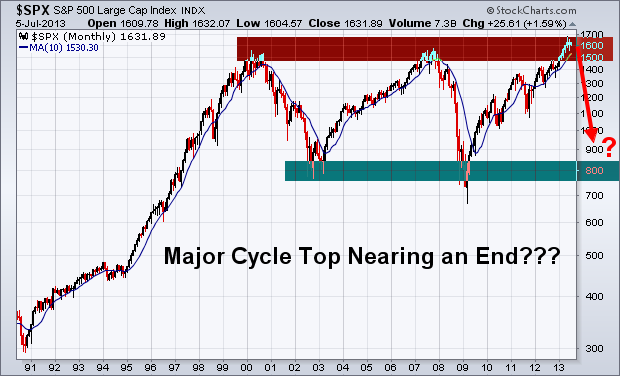
Big Picture Outlook – Don’t Get Me Wrong!
This chart is just to show you what is possible. I am not a perma-bear nor do I want another bear market like this to happen. But knowing what is possible still has to be known. Major market tops are a lengthy process and tends to take several months. If this is the case then it could be a wild and choppy market for the rest of 2013. Do not expect price to just collapse and free fall for 18 months… Dreams like that do not happen. Bear markets must be actively traded because they carry a lot of risk.
The Technical Analyst Conclusion:
This week is do or die for U.S. stocks. We need sellers to step in here and pull stocks down. With the S&P 500 trading at resistance, stocks being overbought on a short term basis and the holiday week behind us, which typically favors higher prices, it is now time for sellers to become active once again.
About the Author
Chris Vermeulen is a gold analyst and trader offering free weekly ETF reports and analysis at www.TheGoldAndOilGuy.com. He is founder ofTechnical Traders Ltd. and chief market analyst for TradersVideoPlaybook.com. Reach Chris at: Chris[at]TheTechnicalTraders.com .


