

Sometimes charts, graphs, and images line up persuasively, and for U.S. stocks John makes the case that this is one of those once in the blue moon times:
A few examples:
Broadening triangle
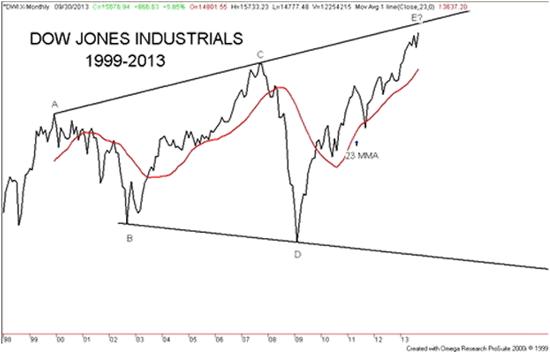
This one is from David Chapman, manager of the Millennium Bullion Fund. As he describes it in a recent SafeHaven article:
A broadening triangle pattern is rare and if it does occur it normally is not seen over such a long period of time. This pattern saw its first peak in 2000 (A) followed by the initial bottom in 2002 (B) followed by the huge 5 year rally that topped in October 2007 (C) then the 2008 financial crisis crash (D). The current rally that got underway in March 2009 could soon make its final top (E).
A bearish broadening or expanding triangle would normally break down through the bottom of the triangle and have objectives that could in theory equal the widest point of the triangle. In this case, that would be D to E. This scenario could result in a complete collapse of the DJI. Some technical analysts such as Robert Prechter of Elliot Wave International www.elliotwave.com and Robert McHugh of McHugh’s Market Forecasting & Trading Report www.technicalindicatorindex.com have long been forecasting a potential final top to the current Grand Supercycle and that it could culminate in a huge financial collapse. This appears to fit their model.
…see more on Magazine cover hyperbole, Excessive P/E ratios, Consumer Sentiment & Margin Debt HERE


