

With the reversal in stocks charted intraday, the S&P 500 Index closed marginally below its 50-day moving average, reaching towards horizontal support around 2040.
Oil inventories declined by 3.6 million barrels surprising analysts that had anticipated another build. The days of supply of oil declined and is now 6.0 days above the 32-year average for this time of year.
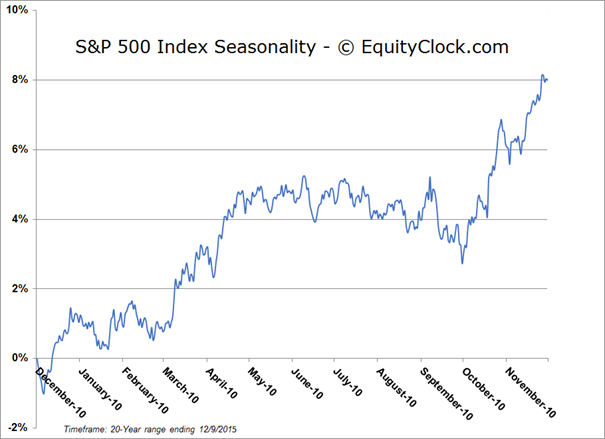
While 2040 remains the lower limit of the longer-term trading range that supported the benchmark in the spring and early summer, the more critical level to watch may be the November low around 2020. A break of this lower level would suggest a short-term trend of lower-highs and lower-lows below the November peak of 2116, possibly confirming the conclusion to the positive intermediate trend that originated from the September low. From a seasonal perspective, the present tax-loss selling period continues through to December 15th, on average, leading to appealing buying opportunities in beaten down sectors. The 50-day moving average on the S&P 500 Index continues to point higher, implying a positive intermediate trend. As of yet, there is little reason to suggest that the yearend rally will fail to materialize, suggesting patience is warranted. Continue monitoring those levels of support, mainly the 50-day moving average around 2050 and the November low around 2020 and reanalyze the market direction should a break occur.
…..for an extensive report with 45 Seasonal Charts go HERE


