

Toronto, Edmonton, and Calgary drop while Ottawa is the new real estate price breakout recipient.
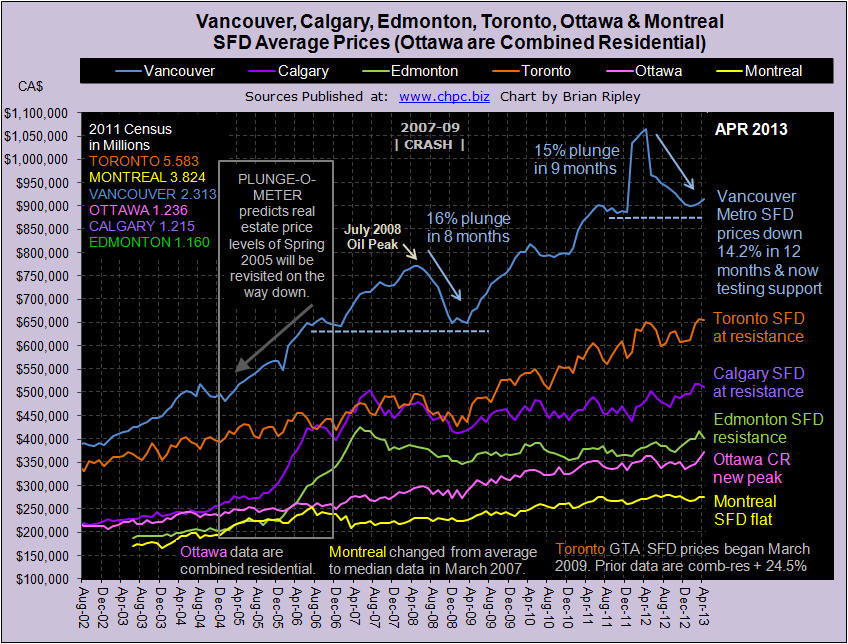
VANCOUVER average single family detached prices in April 2013 ticked up again but remain 14.2% ($150,800) below their peak set last April 2012 (Vancouver Chart). On the short term, price are up fractionally, but on an annual basis, Vancouver is on a sea of red (Scorecard) with combined residential sales down 6.2% Y/Y and prices down 12.6% Y/Y with price momentum solidly negative (-14.2%) and heading towards Extreme Fear on the 12 month change chart.
Now that you have the April data, where do you think Vancouver SFD prices will be one year hence? VOTE HERE.
CALGARY average detached house, townhouse and condo prices in April 2013 have all turned down from their recent record highs, Calgary Chart). I have added the TSX Energy Index plot to the chart to see when correlations occur with housing prices. Real Estate and the energy index are labouring under multiple peaks and price momentum has taken a sharp turn down and threatens to go flat.
The sentiment in Calgary is the least bearish of the 3 markets polled with only 24% of the survey thinking Calgary SFD prices will be 20% lower in 12 months. What do you think? VOTE HERE.
EDMONTON average detached house prices in April 2013 also turned down with Calgary (Canada Chart). The bright spot was townhouse prices popping 2.8% M/M but annually they are down 0.7%. Combined residential sales although up nearly 10% M/M are down 8% for the year (Scorecard). The record high SFD prices of May 2007 are still 5.6% out of reach (Plunge-O-Meter).
TORONTO average detached house prices for the GTA in April 2013 backed off the high set last month (Toronto Chart) and Y/Y sales numbers are down over 5% for detached, townhouse and condos (Scorecard). The weakening sales are driving the market momentum into the flat line. For anyone keeping score, the gap between Vancouver and Toronto housing prices (Vancouver vs Toronto) is narrowing, especially condos and marketers should note that HNWI has fallen in love with Toronto.
Despite recent record highs, sentiment continues to suggest that prices will be down another 20% in 12 months. What do you think? VOTE HERE.
OTTAWA average detached house prices are not available, instead the chart on this site reflects Ottawa’s average combined residential prices. OREB’s report is sparse and opaque and the CMHC, records for Ottawa inventory remain one month lagging. In April 2013 Ottawa combined residential prices zoomed 3.8% M/M for a new record price high on a solid 34.8% M/M sales surge (Scorecard). Ottawa real estate is trading 2.1% above the prior peak set one year ago breaking out from a well defined 2 year channel. Follow the money.
MONTREAL median (not average) detached house prices in March 2013 (I WILL UPDATE WITH APRIL DATA WHEN IT IS RELEASED) ticked up 1.9% M/M but remain in a narrow price channel 1.6% below the all time high price set in June 2012 (Canada Chart). Prices are floating on sales resistance (Scorecard) with combined residential sales 17.3% below last year. In the 2011 Census, Montreal added 6.4% more dwelling units while only adding 5.2% more people. There is no shortage of housing, but there is a shortage of earnings; the Province of Quebec ranks 7th in Canada’s 10 provinces for earnings and shares an unemployment rate with Ontario of 7.7% in March.


