

On April 24 I posted a blog stating that Gold was within a week or so of declaring its next $250 move. See here.
The Gold market worked higher for about a week after the post above, reaching a high of $1,672 on May 1 (a day that became a one-day minor reversal).
Has the $250 move in Gold begun? I am not sure — but I am sure that Gold is right at the edge of the cliff hanging on by its finger nails.
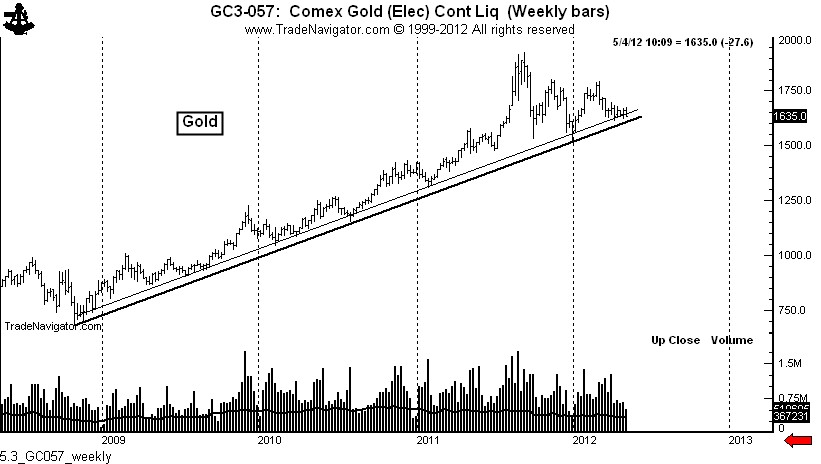
The weekly chart below of Gold shows the major trendline from the 2008 low under the orthodox lows (thick line) and through the week-end closes (thin line).
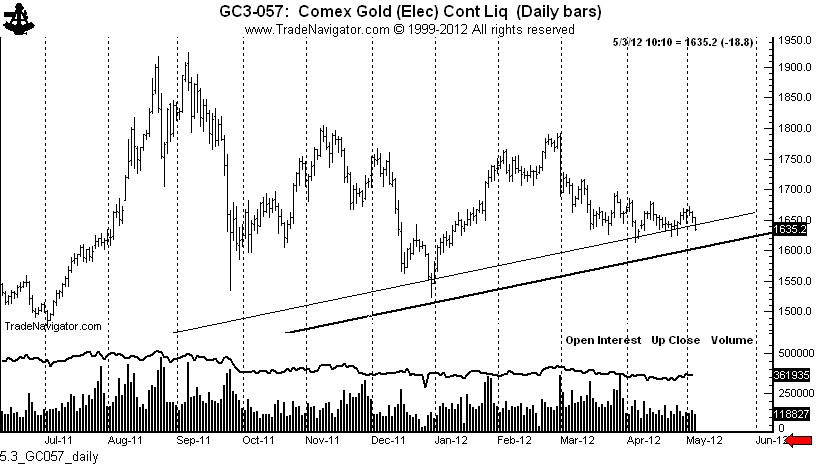
The next chart is a blow up of the previous graph — showing the two key trendlines superimposed on a daily chart.
I need to openly declare that I want to be a bull in Gold — yet I am not presently long. I accept the conventional wisdom bull story in Gold — even though I know that conventional wisdom is usually wrong.
Yet, as the daily chart shows, Gold needs to make a stand at present levels. A move below the April low at $1613 (especially if it’s on Friday) would not be good news for the bulls. Of course there is always the chance the market will spring an historic bear trap by taking out all the stops beneath the April low and immediately turning higher. But, fortunately, bear and bull traps quickly reveal themselves and provide excellent opportunities to get right with the market. Yet, as a chartist, I would have to respect a decisive violation of the trendlines just below the market.
To Read More CLICK HERE


