

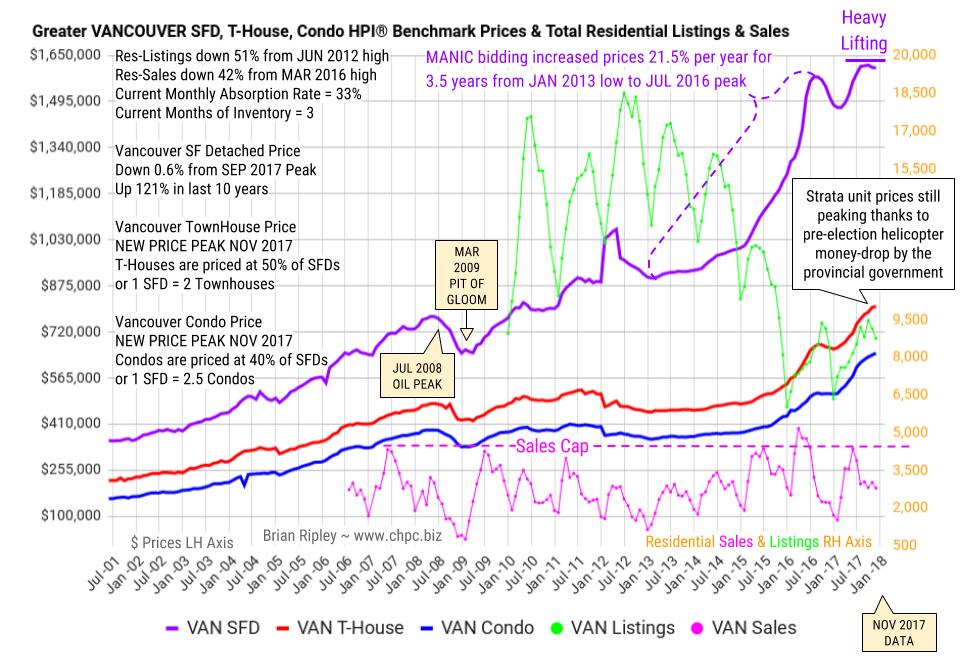
In November 2017, Vancouver detached house HPI prices remained at resistance but strata prices continued ticking up through the July 2016 peak. The manic buying spree moved detached prices up 21.5% per year since the JAN 2013 low and are now up 121% in the last ten years.
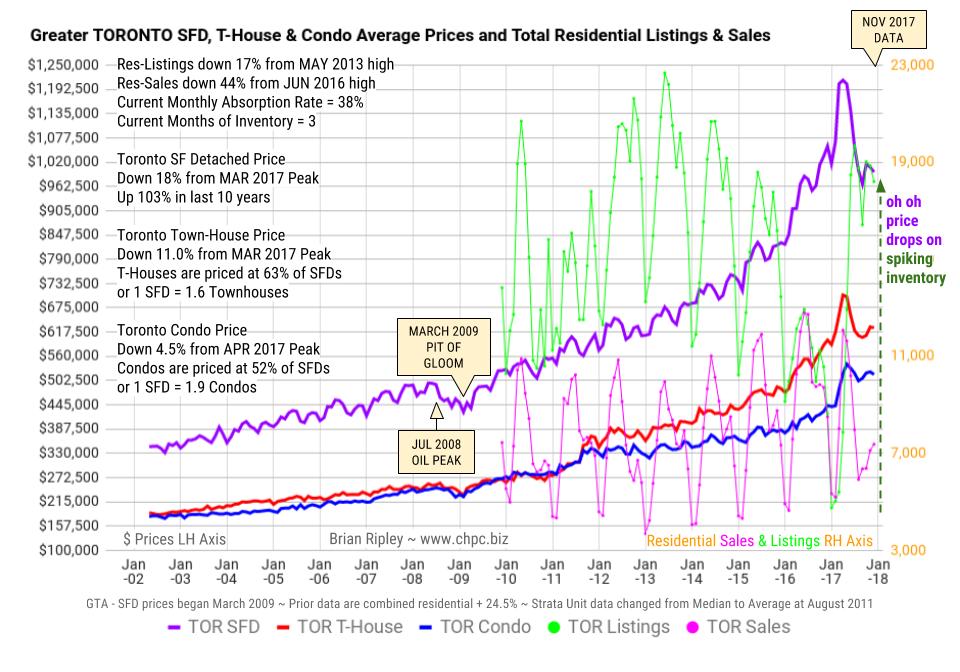
In November 2017 the Toronto housing sector prices remained depressed below their near term showoff spike highs as listing levels spike on seasonally slow sales; that and the winter tendency to hibernate is producing the right side of the “Eiffel Tower” price series.
Compare Vancouver & Toronto Housing Chart HERE


