

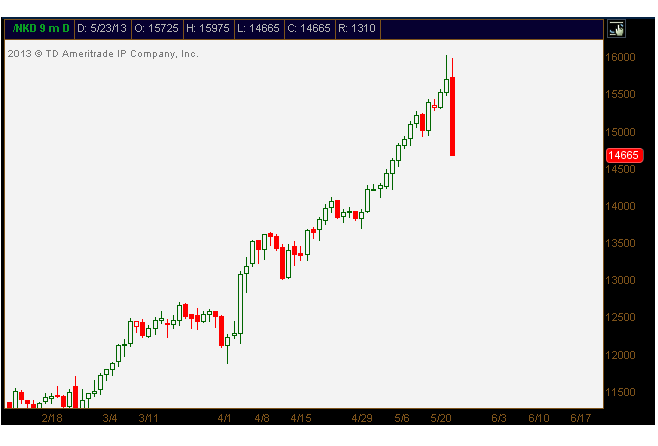
The Nikkei plunged a whopping 1,143 points as the chart shows;
 Global Equities Hammered
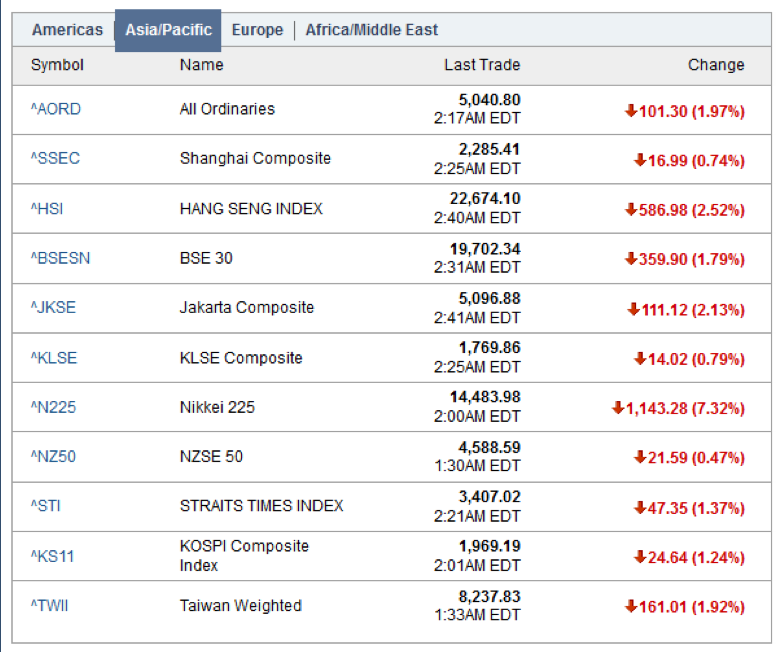
It’s not just the Nikkei that’s being hammered. Asia-Pacific is in a rout as well.
Start of Reflation Bubble Bust?
Is this the start of the great reflation unwind? I don’t know, but we should all hope so.
The bigger the bubble the bigger the crash, and this Fed (central bank in general) sponsored equity and corporate bond bubble is enormous.
Ed Note: The critical point Martin Armstrong’s makes on a Flash Crash like the one described above is to focus on the crashes aftermath to determine its validity:
“The validity of any Flash Crash is determined by the aftermath. You simply cannot manipulate any market defined as changing the trend. So any attempt to impact prices is a short-term manipulation is short-lived. Take the May 6, 2010 Flash Crash in the US share market also known as The Crash of 2:45. The US stock market crash came on Thursday May 6, 2010 in which the Dow Jones Industrial Average plunged about 1000 points (about 9%). Regardless if it was an error or a deliberate attempt to push the market down, it takes place because there is a lack of bid. However, if the move is false, the the market will rapidly recover those losses within minutes or a couple of days. In that case, it was the second largest point swing in history, 1,010.14 points, and the biggest one-day point decline, 998.5 points, on an intraday basis in Dow Jones Industrial Average history. It is the LACK OF BIDS in the market that allows that downdraft to take place. Everyone made excuses from sticky fingers to it wasn’t real. The market failed to generate any sustainable rally. It rebounded rapidly closing at 10520.32 that day, but the next day it closed lower 10380.43. The market then rallied ONLY for 3 days (3 day reaction rule) reaching the highest closing at 10896.91 failing to even close above the high of the day of the crash 10925.86. The 3 day reaction rule worked and the market fell to new lows bottoming at .9596.04 on July 1, 2010The market is NEVER wrong. It does not matter if it was thin or robust trading. All the excuses in the world are still excuses. It is what it is. The Dow elected a Daily Bearish 04/27 1 day after the high. The trend was headed lower.
During a Flash Crash, (1) there is a lack of bids underlying the market, and (2) typically what happens is market-makers withdraw out of UNCERTAINTY. The very day of the low in the 1987 Crash, I looked at the screen and saw a 240 call option was $300 in the S&P when it fell to 180. I picked up the phone and tried to buy. The market-makers withdrew. ONLY my experienced saved me. I would have said buy at the market. I hesitated and put in a limit order. The next trade was 3000. With no market makers I would have been filled on that limit offer.

It is what it is. Excuses are simply the way to say you were not wrong, it was fake. But the truth is always revealed by the price. It is what it is.” – Martin Armstrong
Martin Armstrong’s perspective fascinated so many at last night’s Emergency Gold Summit, as you can tell from this email sent to Martin:
Thank you. Your insight into how everything is connected has saved me a fortune. I cannot tell you how many people showed up tonight simply to hear you. As the moderator said, you have the best track record of anyone. Your insight into the world is amazing. I understand what you said tonight as so many were talking about your speech walking out. It will be the markets that force political change. You have thousands of followers here in Vancouver. You should know that.
Thanks for everything you are doing.
R…S,,,
The entire Emergency Gold Summit Video presentation in which David Bensimon, Mark Leibovit and Martin Armstrong’s presentation and specifics about how everything is connected can be found HERE


