


readers know I’ve been on the “down low” waiting for the Greek elections and FOMC statement. This, and staying liquid, proved the right move for now. After all, as someone famously said, “tomorrow’s another day.”
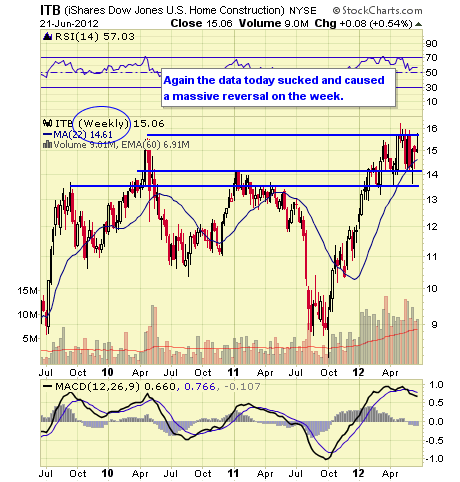
Markets started the trading day inundated by a litany of crummy economic data. Jobless Claims (387K vs 383K expected & prior revised higher as per normal to 389K) made for a mild headline beat but overall the trend is worsening. The “flash” (why do we need one?) PMI estimate came in cold (52.9 vs 53.8 expected & prior 53.9); Bloomberg Consumer Comfort Index fell again (-37.9 vs -36.8 previous); Existing Home Sales were poor dropping 1.4% (4.55M vs 4.62M prior) or housing market not “fixed”; if that weren’t enough, the important Philly Fed Survey imploded (-16.6 vs .5 expected & prior -5.8).
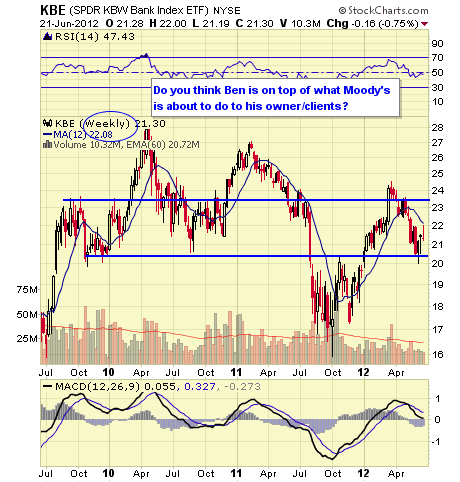
Put these together and Operation Twist seems pathetically inadequate requiring perhaps another Fed meeting adjustment which would be seen by many as more politically motivated. Let’s face it; Bernanke & Co have gotten things wrong. The administration and congress haven’t been helpful either.
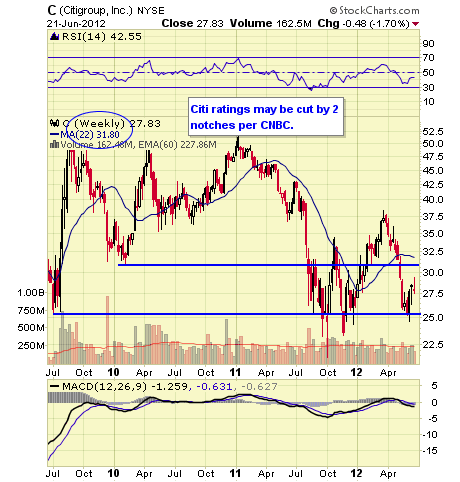
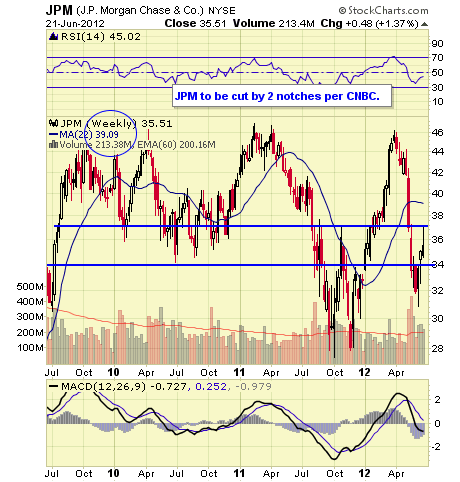
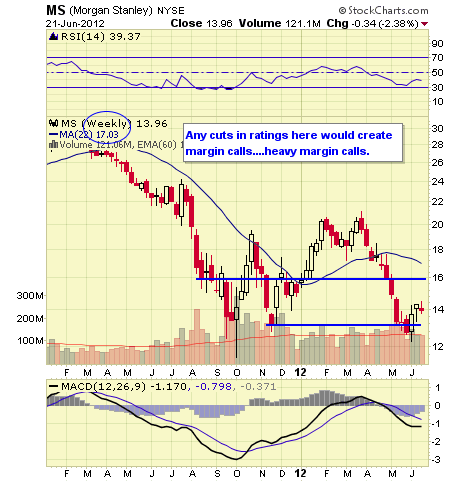
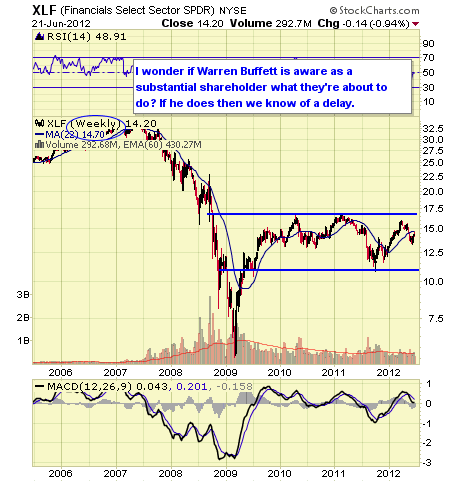
Goldman Sachs (GS), and no doubt prepositioned, issued a short S&P 500 call. Late in the trading day rumors Moody’s would issue bank downgrades this evening and into Friday morning. Names mentioned for downgrade include Citigroup (C), Bank of America (BAC), JP Morgan (JPM), Goldman Sachs (GS) and Morgan Stanley (MS). For some banks this could mean margin calls especially for MS.
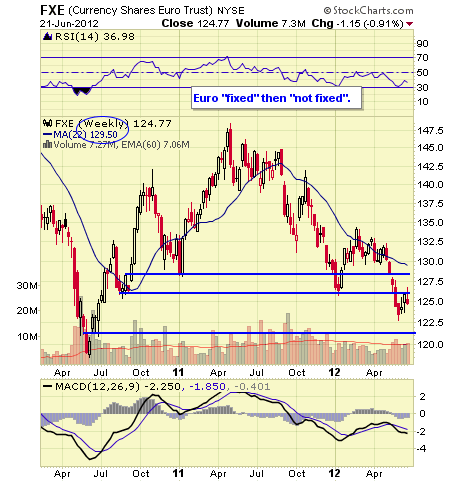
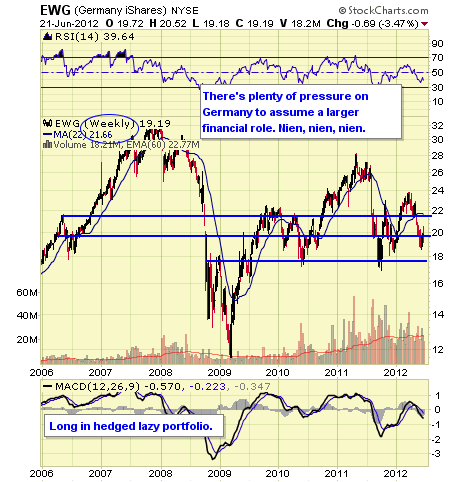
In the eurozone, the Bundesbank rejected Italy’s Monti call for ECB bond purchases—Europe not “fixed”.
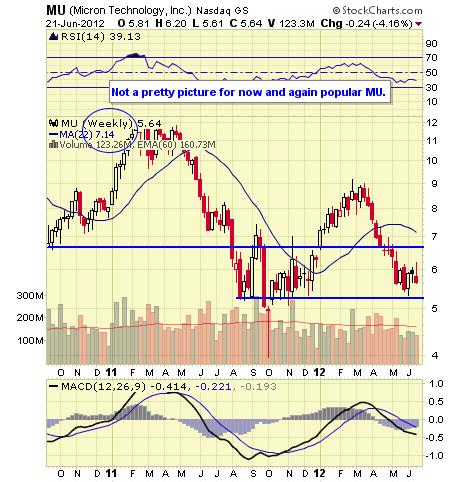
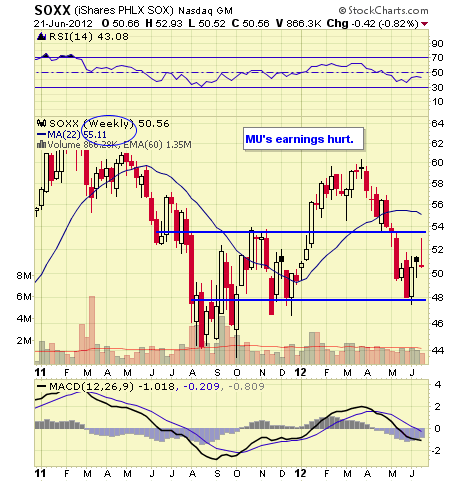
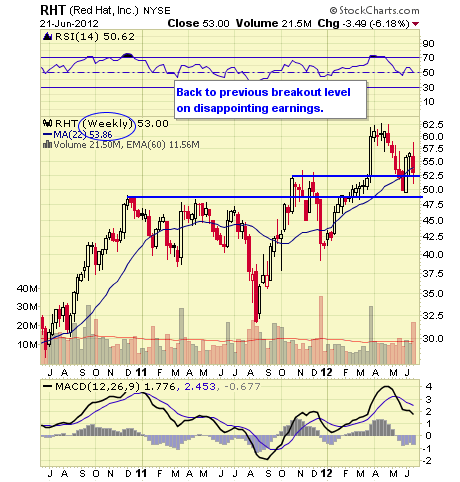
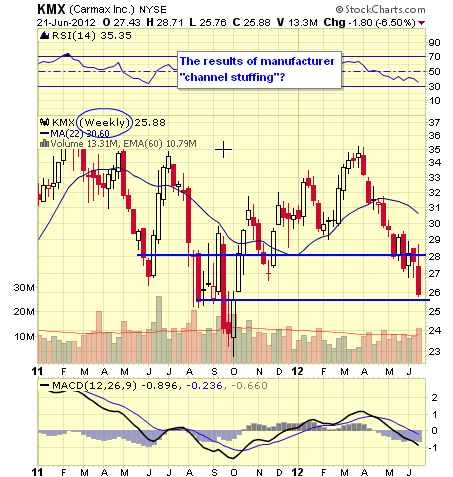
On the earnings front, Micron (MU), Red Hat (RHT) and CarMax (KMX) all reported results that missed analysts’ expectations and those stocks fell sharply as did just about everything else
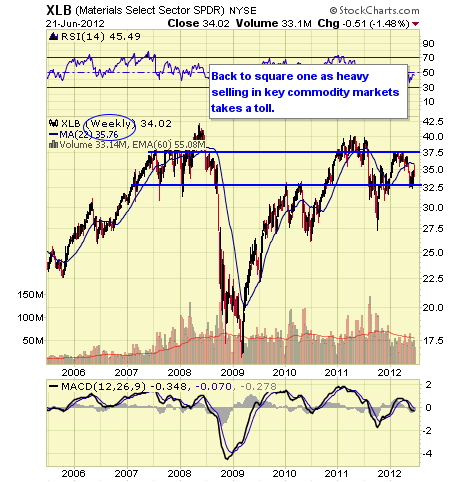
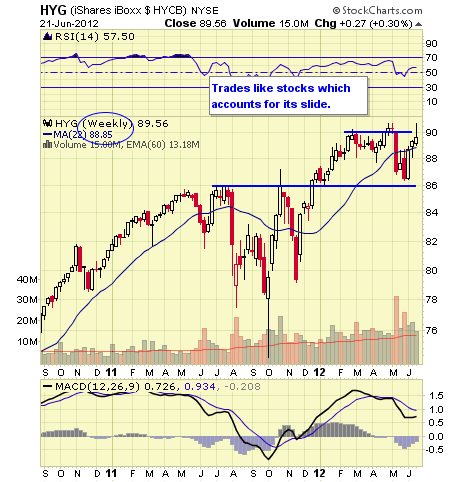
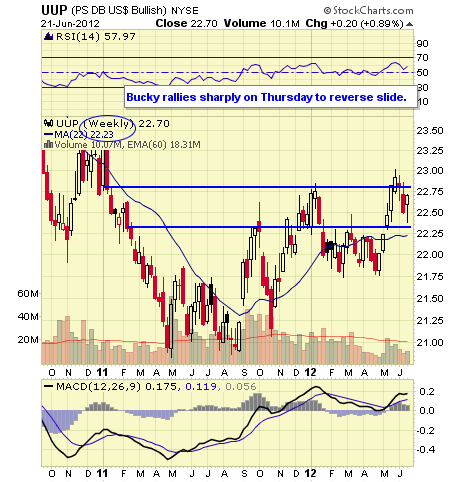
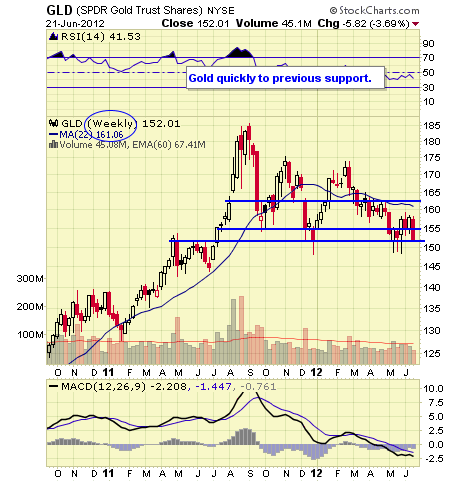
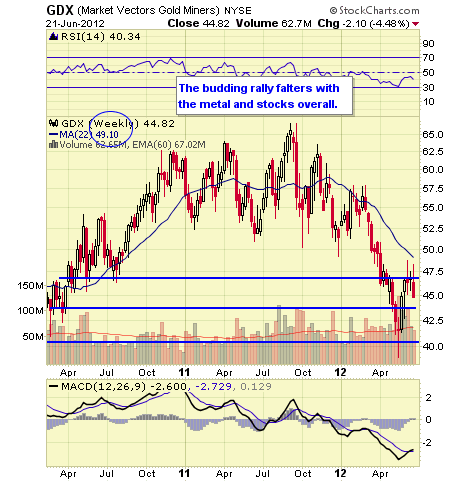
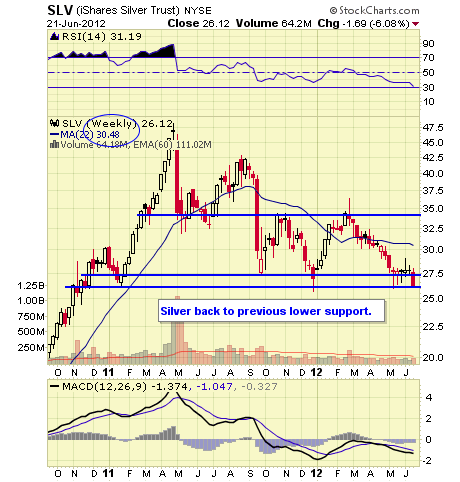
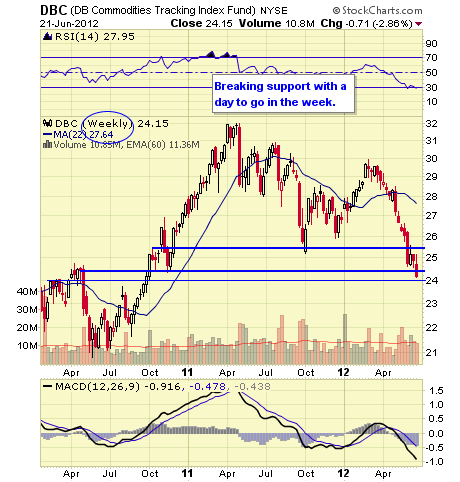
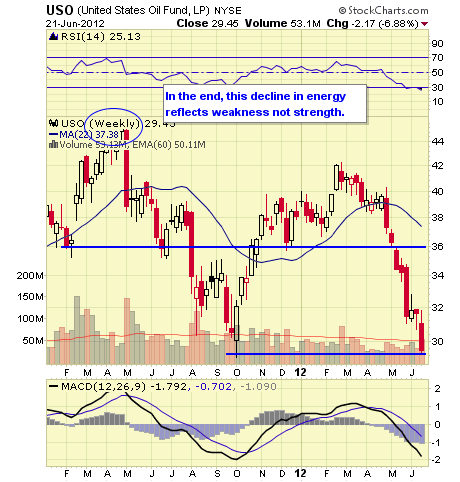
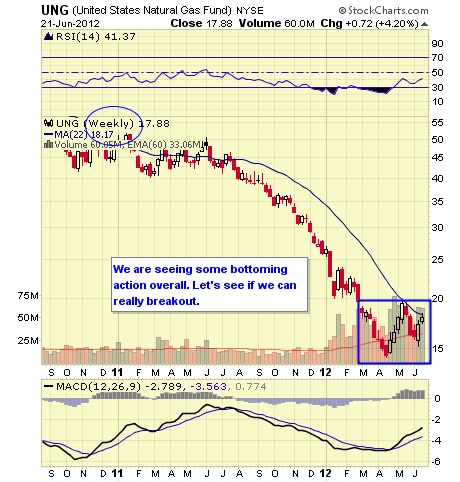
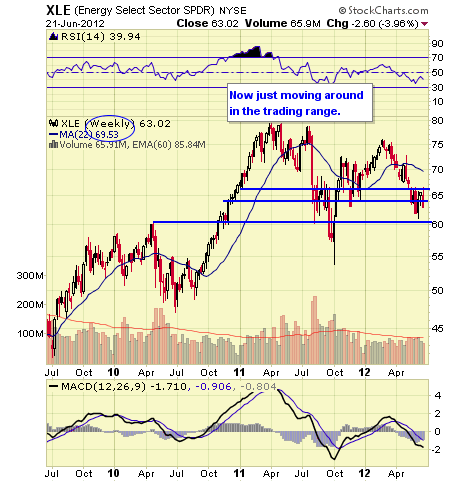
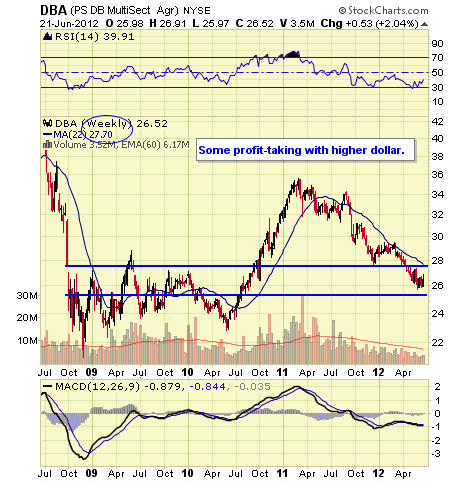
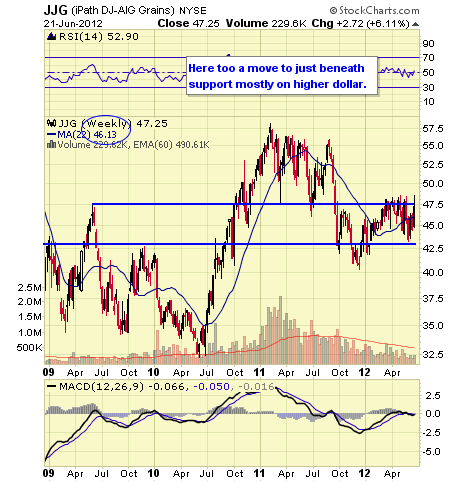
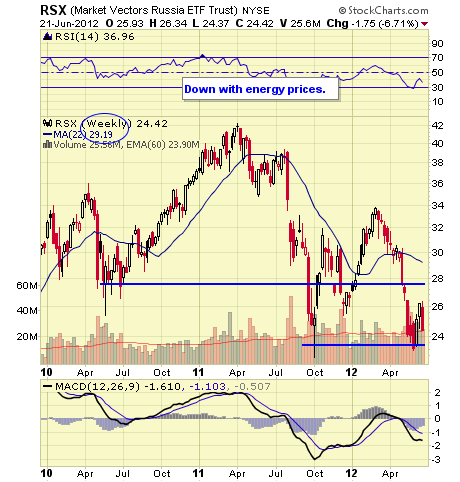
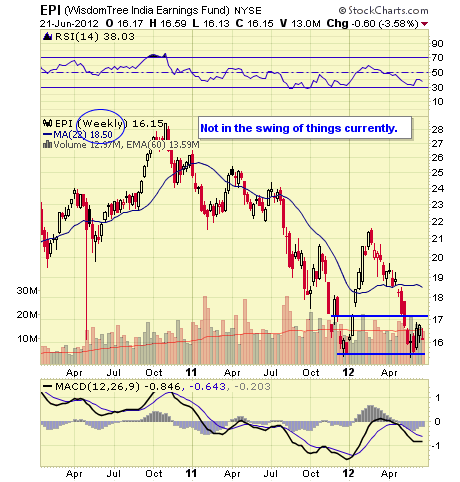
Commodity markets (DBC), (USO) & (JJC) for example continued their decline. The dollar (UUP) was higher on eurozone confusion and gold (GLD) fell sharply as investors scramble for cash to meet inevitable margin calls.
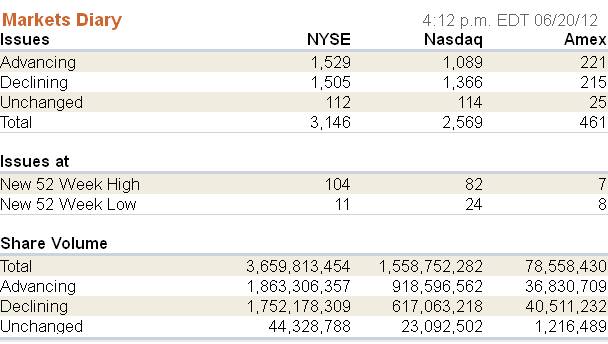
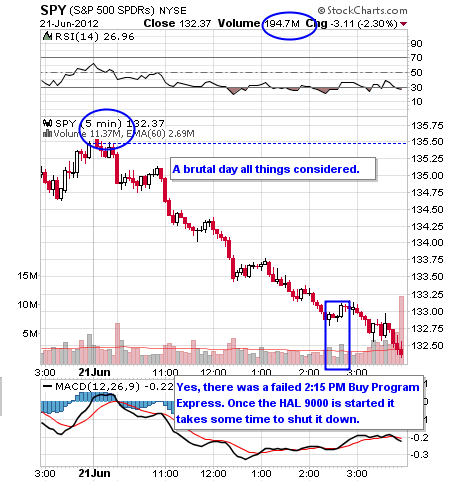
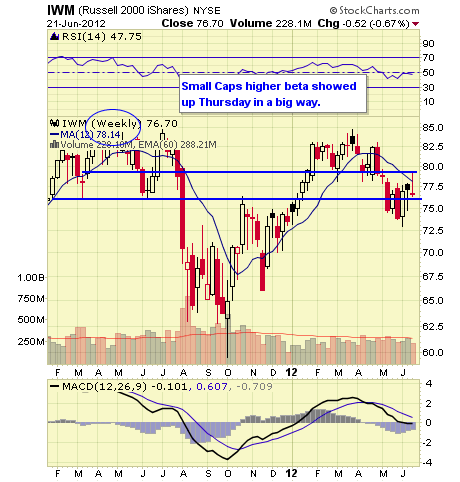
Volume was higher by recent averages on the large sell-off which is quite common for days like this. Breadth per the WSJ was quite negative and short-term overbought conditions (noted here yesterday) have been wiped-out.


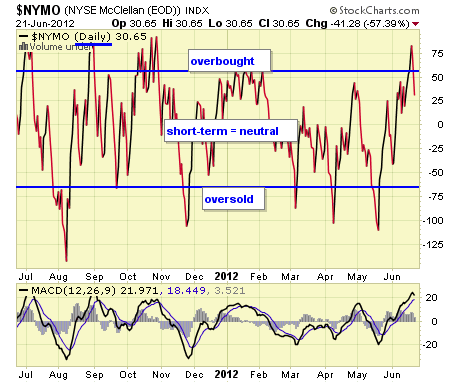
The NYMO is a market breadth indicator that is based on the difference between the number of advancing and declining issues on the NYSE. When readings are +60/-60 markets are extended short-term.
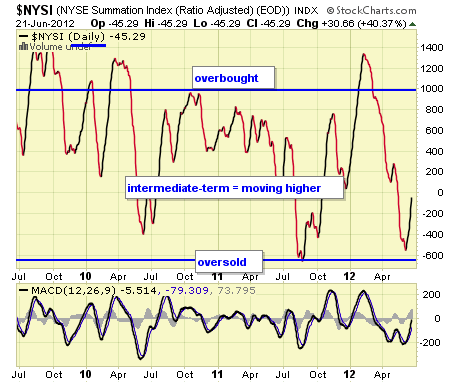
The McClellan Summation Index is a long-term version of the McClellan Oscillator. It is a market breadth indicator, and interpretation is similar to that of the McClellan Oscillator, except that it is more suited to major trends. I believe readings of +1000/-1000 reveal markets as much extended.
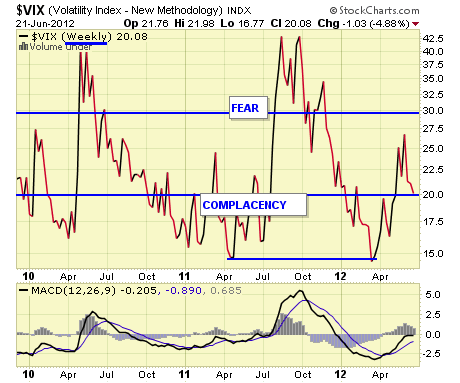
The VIX is a widely used measure of market risk and is often referred to as the “investor fear gauge”. Our own interpretation is highlighted in the chart above. The VIX measures the level of put option activity over a 30-day period. Greater buying of put options (protection) causes the index to rise.
Moody’s made the announcement of lowering ratings on 15 banks. The funny news is Morgan Stanley was only cut 2 notches causing the stock to rally in late trading because it was better than expected. Really, you can’t make this stuff up.
Here is the full statement.
There is no economic news Friday unless some ring in from the eurozone.
Disclaimer: The ETF Digest maintains active ETF trading portfolio and a wide selection of ETFs away from portfolios in an independent listing. Current “trading” positions in active portfolios if any are embedded within charts: Lazy & Hedged Lazy Portfolios maintain the follow positions: VT, MGV, BND, BSV, VGT, VWO, VNO, IAU, DJCI, DJP, VMBS, VIG, ILF, EWA, IEV, EWC, EWJ, EWG, & EWU.
The charts and comments are only the author’s view of market activity and aren’t recommendations to buy or sell any security. Market sectors and related ETFs are selected based on his opinion as to their importance in providing the viewer a comprehensive summary of market conditions for the featured period. Chart annotations aren’t predictive of any future market action rather they only demonstrate the author’s opinion as to a range of possibilities going forward. More detailed information, including actionable alerts, are available to subscribers at www.etfdigest.com.
Disclosure: I have no positions in any stocks mentioned, and no plans to initiate any positions within the next 72 hours.
Please help improve Seeking Alpha:
Did you find this article useful?
- Top 10 U.S. And Global Consumer Staples ETFs Thu, Jun 21
- Top 10 Healthcare ETFs Tue, Jun 19
- Investors Expect Bailouts And QE Fri, Jun 15


