IS THE CORRECTION OVER?
Precision timing for all time frames through a multi-dimensional approach to technical
analysis: Cycles – Breadth – P&F and Fibonacci price projections
and occasional Elliott Wave analysis
“By the Law of Periodical Repetition, everything which has happened once must happen again, and again, and again — and not capriciously, but at regular periods, and each thing in its own period, not another’s, and each obeying its own law… The same Nature which delights in periodical repetition in the sky is the Nature which orders the affairs of the earth. Let us not underrate the value of that hint.” ~ Mark Twain
Current Position of the Market
SPX: Very Long-term trend – The very-long-term cycles are down and, if they make their lows when expected (after this bull market is over) there will be another steep and prolonged decline into late 2014. It is probable, however, that the steep correction of 2007-2009 will have curtailed the full downward pressure potential of the 120-yr cycle.
SPX: Intermediate trend – The intermediate uptrend is still intact and the short-term correction could be over.
Analysis of the short-term trend is done on a daily basis with the help of hourly charts. It is an important adjunct to the analysis of daily and weekly charts which discusses the course of longer market trends.
Daily market analysis of the short term trend is reserved for subscribers. If you would like to sign up for a FREE 4-week trial period of daily comments, please let me know at ajg@cybertrails.com.
Market Overview
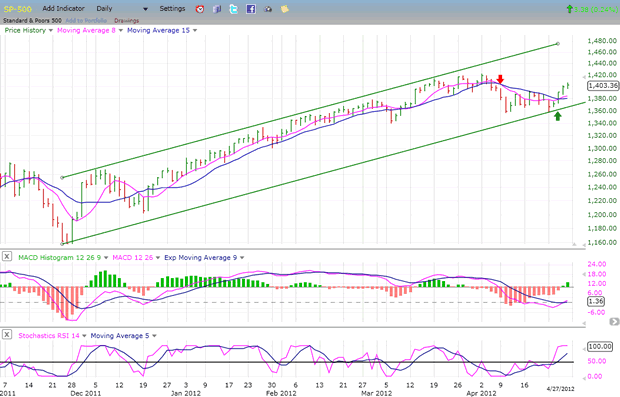
After last week’s SPX performance it’s possible that the market correction is over. The cycle low which was ideally due for next week may have come in about a week early, and could have been responsible for the spike down to 1359 and the subsequent rally. This would mean that the 1357 low of 4/10 has held and that the SPX could see higher prices before it is challenged again.
With this market action, my former scenario may have to be modified. The rally which started at 1359 last Monday met its initial Point & Figure projection of 1405 on Friday. It’s a good bet that we could get a correction now that this target has been reached. The type of correction will decide whether the cycle has truly bottomed early, or if it is still ahead of us. The reason why this is not certain is because there are other current cyclical factors which could explain the market’s behavior.
EW analysts are divided on the current structure. The view that 1359 was the end of wave 4 and that wave 5 is now underway is meeting with skepticism by those who believe that the corrective action which started at 1422 is not over. How the SPX corrects from 1405 should go a long way toward clarifying the structure.
Should this be the beginning of wave 5 from 1359, we should have just completed wave 1 of 5 at 1405 on Friday. After a corrective wave 2, the next wave should take us to about 1424/1427, and there is the potential for an ultimate move to about 1450. A P&F projection to that level is confirmed by several Fibonacci calculations — providing the SPX can rise above 1422. If the SPX cannot get above that level, it would force us to consider that we may only be dealing with an extension of the correction.
To Read More CLICK HERE