

With the S&P 500 (broad gage of U.S. stocks) up over 16% year-to-date and almost 31% since the beginning of 2012, it is fair to ask if broader North American markets should be considered overvalued. Anecdotally, it is certainly more difficult to identify striking value than it has been over the past several years – but not impossible as growth has picked up in select areas.
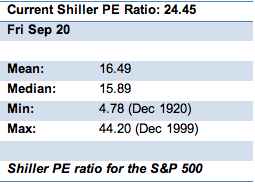
One such method which has proven successful in identifying market extremes (both over and undervalued) is the Shiller PE Ratio or cyclically adjusted price-to-earnings ratio, commonly known as CAPE. Developed by Yale economist Robert Shiller and built off the work of legendary value investors Benjamin Graham and David Dodd, CAPE is a valuation measure usually applied to broad equity markets. It is defined as price divided by the average of ten years of earnings, adjusted for inflation.
The central theme behind the CAPE is simple. Taking a multiple of one year’s earnings is misleading because stock markets naturally adjust when investors believe profits are cyclically high or cyclically low. Compare prices instead to the average of earnings over 10 years (Prof Shiller also corrects for inflation) and it becomes clearer whether stock markets are overvalued or undervalued.
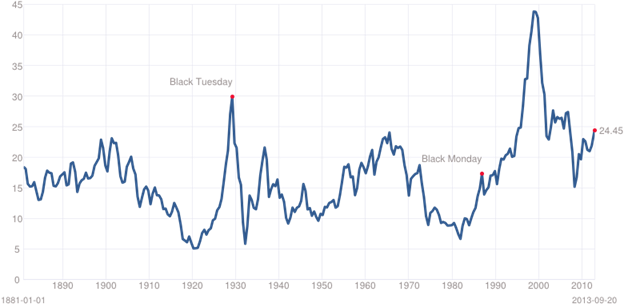
For over a century, extremes in the CAPE have coincided with favourable times to buy and sell. By staying far above its long-term average during the rebound that followed the internet bust from 2003 to 2007, the CAPE also provided a warning that the rally was not to be trusted – ahead of the far worse crisis of 2007-09.
Prof Shiller and the CAPE (not the one some believe he wears) are sound the alarm once again, recently implying that the U.S. market is 62% overvalued and more expensive than any other big stock market.
Economics without debate is like politics without scandal. It’s not going to happen. It should be no surprise that the CAPE is under attack from another renowned economist, Jeremy Siegel, who contends that it is based on faulty data. Many on Wall Street discount CAPE, but most have a vested interest.
Prof Siegel of the University of Pennsylvania’s Wharton School has produced a new version of the CAPE, which he says corrects Prof Shiller’s mistakes. His version of the CAPE (again not the one his followers think he wears) suggests that the U.S. stock market is sending a different signal – stocks are cheap.

But there is plenty of reason to worry broadly about the economy including public (unfunded pension liabilities included) and private (consumer) debt. While U.S. consumer debt has been headed in the right direction, levels still remain historically high. U.S. unemployment is also a big concern.
Within Canada, our relative insulation from the great recession has unfortunately spared us a valuable lesson and consumer debt has not been paid down. In fact, Canadians are borrowing more, piling on consumer debt – credit cards, conventional bank loans, car loans and lines of credit. At some point this ends and a spending vacuum could limit growth.
Perhaps this partially justifies the S&P TSX Composite’s poor performance on a relative basis, being up a scant 3.3% and just 7.5% since the start of 2012. Slumping commodity prices (outside oil of late) are also a major contributor to the underperformance of the resource laden TSX.
So where does this epic tug-o-war leave us – which one of these statements is true?
“The stock market is overvalued.” “The stock market is undervalued.” Investors ask us these every day.
From our perspective, both statements are simplistic and most often irrelevant.
It is a market of stocks, not a stock market.
We do not recommend you buy “the market,” when you look to beat the market. Our clients create their Small-Cap Growth Stock Portfolios with discipline by purchasing 8-12 cash producing stocks over a 12-18 month period. Our holding periods are typically between 1-5 years and beyond.
Over that 1-5 year period, the broader market will have its ups when it is likely overvalued based on a number of metrics and downs when it may show as undervalued based on those same metrics. What is important to us and to you as a client is whether your 8-12 stocks are continuing to create shareholder value through a number of company specific metrics including cash flow increases, growth, a higher return of capital (dividends) and an improving balance sheet.
Outside of this, Mr. Market will create a great deal of “noise” on a day-to-day basis. Try not to pay too much attention – it will allow you to sleep far better each night.
|
KeyStone’s Latest Reports Section |


