

In this Report I would like to look at the Chartology of the precious metals complex as this is either a consolation phase or as some think a bottoming formation is building out that will lead to the next bull market. In order to grasp what is really going on we need to look at all the possibilities and try to gain some perspective on which course of action the precious metals complex is likely to move in the short to intermediate time frame up or down.
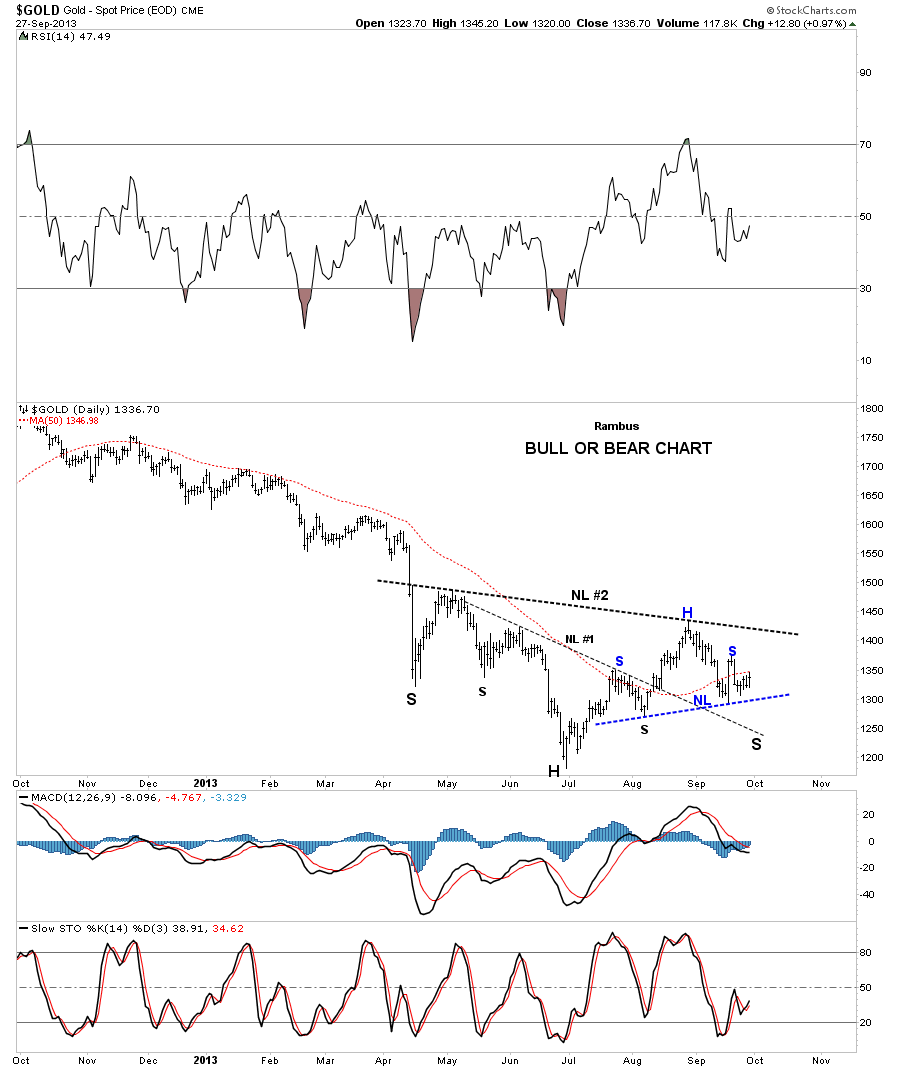
The first chart I would like to show you is what I call my bull or bear chart. Many chartists are looking at the inverse H&S bottom that actually started to form back in April of this year, left shoulder. The head was formed during the late June low followed by the ten week rally to the September high around the 1435 area. As you can see there are two black necklines labeled #1 and #2 that shows a possible double inverse H&S bottom. In order to keep the symmetry alive gold would need to decline down toward the 1250 area where it could then form the second right shoulder. To confirm an inverse H&S bottom is in place gold would have to takeout the bigger neckline #2 around the 1400. This would be the bullish case for gold. The bearish argument for gold is that it is forming a H&S consolidation pattern as shown by the blue annotations. The flash rally that took everyone by surprise made the right shoulder high which quickly reversed direction. So at this point we have two inconclusive patterns to work with.
….17 more charts & commentary HERE


