

In Aug 2012 buyers retreated to the sidelines and huge sales resistance across Canada continued (Scorecard) with double digit M/M combined residential sales drops of 11-21% depending on locale. Pricing power continues to erode (Plunge-O-Meter) as sellers rush the exits. In 4 months since their peaks, average SFDs in Toronto have dropped 6.6% and in Vancouver they have plunged 11.5%
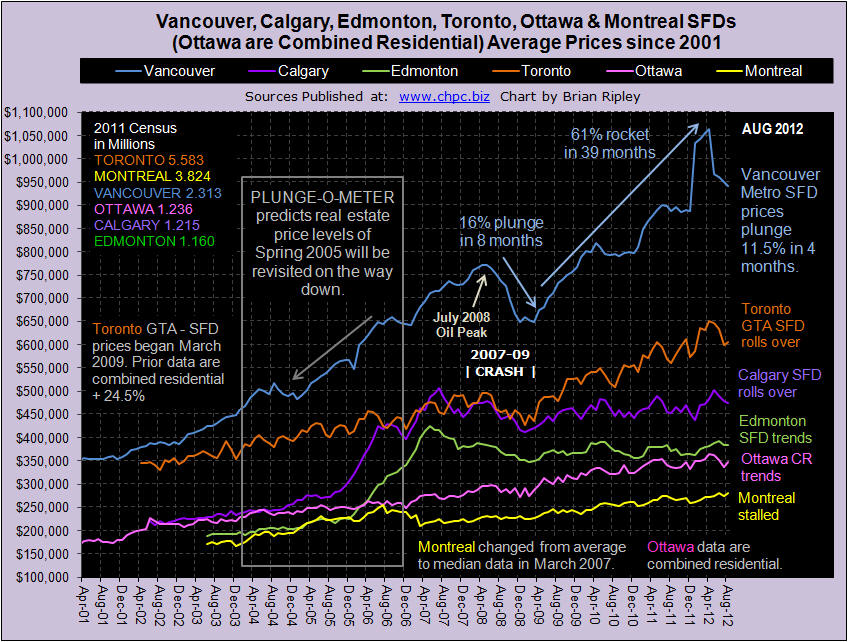
Vancouver average single family detached prices in August 2012 dropped again for a four month plunge of 11.5% and a loss of of $122,700 which is a 69% retracement of the $177,329 gain since the beginning of the year (Vancouver Chart).The Chickens are Coming Home to Roost
Click HERE to view the extended summary of Vancouver Housing Changes as well as the Housing Price Changes for Calgary, Edmonton, Toronto, Ottawa & Montreal for August 2012
That second or third condo you bought after standing in line with the herd, or the big house with the lucky address you agreed to bid over the top for in the bidding war is now looking like an unlucky (dead) albatross around your neck.
Now you are faced with the tedium of having to do the math and make the tough decision.
Do you cut and run with whatever is left of your equity or stick around and subsidize the negative yield and for how long?
Suddenly cash in a savings account looks good to you when compared to the vigorish you are obliged to pay.


