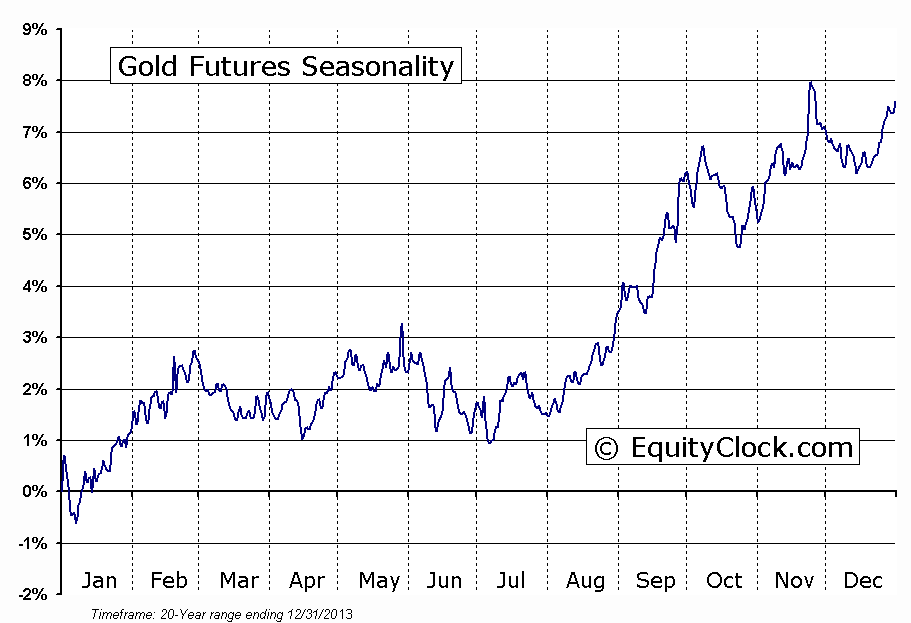
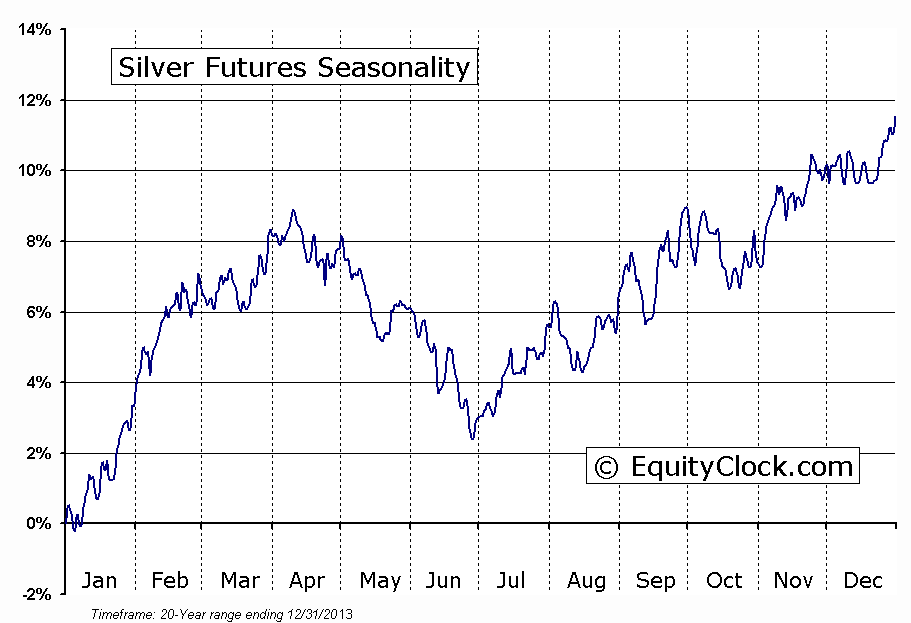
The month of September has historically been the strongest for precious metals. Since the start of the current bull market, gold has averaged a gain of 2.6% during the month of September. This is typically followed by a smaller gain of 0.8% in October and then a few more strong months in November, January and February. Taken together, we are exiting the weakest seasonal period for gold (Spring-Summer) and entering into the strongest seasonal period (Fall-Winter).
Chart & more commentary HERE
…Also seasonal charts from Equity Clock, you might also want to click on a chart below to be taken to Jon Vialoux’s excellent Stock Market Report for Sept. 4th – Money Talks Editor