

1. Gold has staged a strong rally, and the recent action has created more positive signals, from a technical perspective.
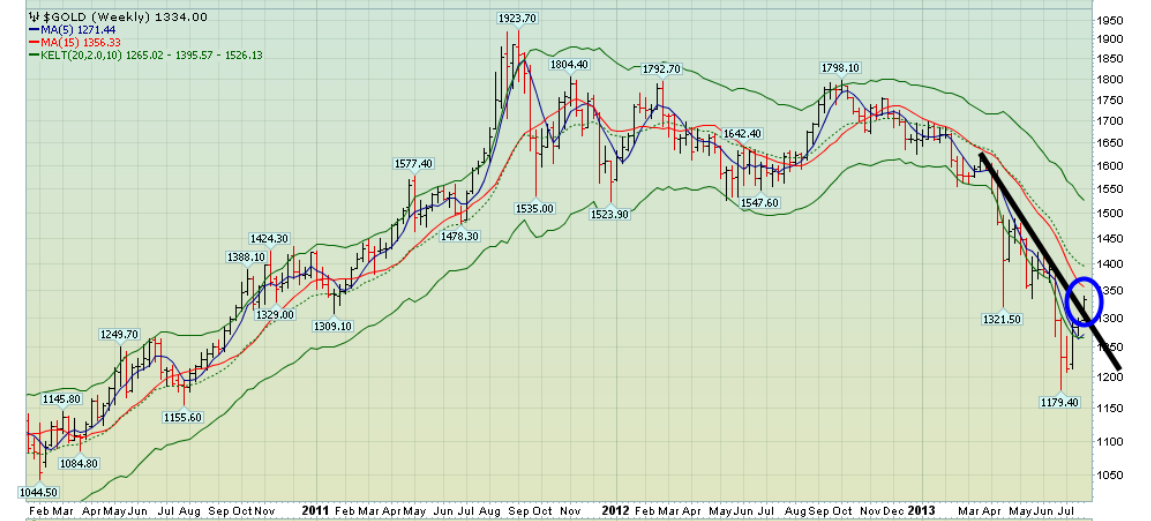
2. Please click here now for larger version. That’s the weekly gold chart, and a key downtrend line has been penetrated. Note the breakout move that I’ve highlighted with a blue circle.
3. I’m a seller here, but not a top caller. When the gold price rises, traders must be sellers, and gold is certainly rising now!
4. Gold has jumped about $160, from the $1180 area lows. Significant sell-side HSR (horizontal support & resistance) sits in the $1320 – $1340 area.
5. To view that HSR, please click here now . Note the black HSR lines that I have annotated on this weekly chart. Traders should be sellers in this price area.
6. I consider the act of booking losses in the gold market to be an act of “tactical madness”. Sell positions that have a profit.
7. Gold is arguably the world’s greatest asset, so stop-losses are not required when trading it without leverage.
8. There is another line of resistance on the weekly chart, that traders can use for profit booking. To view it, please click here now .
9. Note the rising black trend line. From current price levels, resistance should come in the $1375 area.
10. There is no such thing as selling “too early”; if gold rises to $1375, $1400, or even higher. No error is made by traders who sell in the $1280 – $1340 area, provided that what they sell, is at a profit!
11. In the big picture, gold can go quite a bit higher. On the weekly chart, I use the 5, 15 series of moving averages (MA) as a key indicator, and they are beginning to look quite bullish. Moving average signals are best applied to potential trending movements, rather than to price ranges.
12. Please click here now . Note the sell signal that occurred back in the fall, in the $1700 area. If a moving average buy signal occurs soon, nobody knows whether gold will begin a trending move, or just grind sideways in a trading range.
13. In the market, there is a role for “cheerleading”, and my suggestion is that the gold community should cheer for an uptrend to begin, if the 5, 15 MA series shows a crossover buy signal.
14. In the short term, gold also looks good. Please click here now . You are looking at the daily chart for gold. The $1300 zone is now buy-side HSR, and the green downtrend line also offers good support.
15. Note the position of my stokeillator, at the bottom of that chart. While the overall technical picture is strengthening dramatically, short term tacticians will be sellers here. Once the stokeillator lines cross into a sell signal, gold is likely to rest, but not for long!
16. Gold has staged an impressive rally, gaining about 14% from the lows near $1180. Gold stocks have done much better, and investors know that I have not endorsed the “growth with safety” trade (sell gold stocks and buy bullion).
17. Gold stocks are a “potential growth with very real risk” trade. Investors who want to get richer need to be serious risk takers, and the current GDX chart shows that potential reward can quickly become very real.
18. Please click here now . That’s the GDX daily chart. While gold has rallied by about 14%, GDX has surged 22% higher.
19. Volume analysis is arguably more important than price analysis, as many technicians know. Note the 3 volume bars that I’ve highlighted.Those huge bars suggest that the technical breakout above the downtrend line could be a significant one.
20. GDX now has 3 minor buy-side HSR lines beneath the current price, and the gold stock bears appear to be nervous and confused.
21. I believe the market should be viewed as a war. To view your gold stocks opponent (the bears) in the great gold war, please click here now .
22. That’s the daily DUST-nyse chart. DUST is a triple-leveraged bet against gold stocks (via GDX), calculated on a daily basis. The bears appear to be on fire, technically. In only 3 weeks, the price of DUST has crashed by about 50%.
23. While DUST is oversold in the very short term, I want you to look at the buy-side HSR in the $70 area. This is a very high-priced ETF, and the main uptrend (highlighted in black) has just been “vaporized”. DUST should rally from here, but to what price point? Supply is directly overhead.
24. The massive volume bars on the GDX chart and the horrific technical damage that is clearly apparent on the DUST chart indicate that the bulls are beginning to win some battles. A break under $70 on that DUST chart could literally wipe the bears off the price map. Bullish gold stock investors have a number of solid reasons to feel confident now, but let’s not get too cocky!
Jul 23, 2013
Stewart Thomson
Graceland Updates
website: www.gracelandupdates.com
email for questions: stewart@gracelandupdates.com
email to request the free reports: freereports@gracelandupdates.com
Stewart Thomson
email: stewart@gracelandupdates.com
email: stewart@gracelandjuniors.com
email: stewart@gutrader.com


