

On its wednesday report, the Fed remained committed to its present bond buying program. The FOMC cited two risks to its “modest” growth outlook: rising mortgage rates and stubbornly low inflation. The Fed’s statement noted that “the Committee recognizes that inflation persistently below its 2 percent objective could pose risks to economic performance, but it anticipates that inflation will move back toward its objective over the medium term.” The Treasury Inflation Protected ETF (TIP) jumped on the statement, firming up recent gains since the low charted in June. Inflation expectations, as gauged by the ratio between the Treasury Inflation Protected ETF (TIP) and iShares Barclays 7-10 year Treasury Bond Fund (IEF), have been trending lower all year, resulting in a rare divergence with equity markets.
The recent rebound in inflation expectations is conducive to strength in the price of Gold, which benefits from a period of seasonal strength between the end of July through to October. Gold finished the session with minor losses, reluctant to trade away from its 50-day moving average line.
The above chart represents the seasonality for Gold Futures (GC) Continuous Contract for the past 20 years.
- Date range: January 1, 1990 to December 31, 2009
- Type: Commodity Futures – US
- Symbol: GC
Gold Futures Continuous Contract Seasonality
Analysis has revealed that with a buy date of September 13 and a sell date of May 23, investors have benefited from a total return of 183.61% over the last 10 years. This scenario has shown positive results in 9 of those periods.
Conversely, the best return over the maximum number of positive periods reveals a buy date of September 16 and a sell date of May 20, producing a total return over the same 10-year range of 159.82% with positive results in 10 of those periods.
The buy and hold return for the past 10 years was 125.11%.
**Results shown are compounded
How to Invest
UBS E-TRACS CMCI Gold Total Return ETN (Public, NYSE:UBG) – Info – UBS E-TRACS CMCI Gold Total Return is designed to track the performance of the UBS Bloomberg CMCI Gold Total Return, less investor fees. The CMCI Gold TR measures the collateralized returns from a basket of gold futures contracts. The commodity futures contracts are diversified across five constant maturities from three months up to three years. Expense Ratio: 0.30%
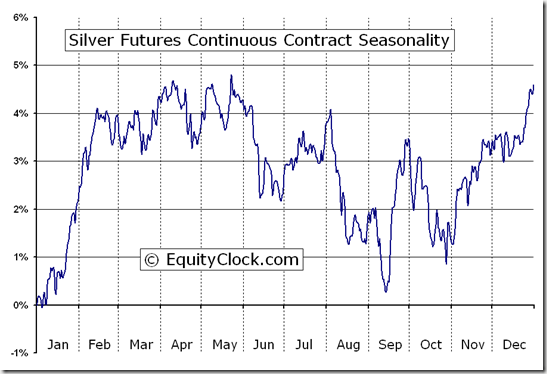
The above chart represents the seasonality for Silver Futures (SI) Continuous Contract for the past 20 years.
- Date range: January 1, 1990 to December 31, 2009
- Type: Commodity Futures – US
- Symbol: SI
Silver Futures Continuous Contract Seasonality
Analysis has revealed that with a buy date of September 16 and a sell date of April 11, investors have benefited from a total return of 314.85% over the last 10 years. This scenario has shown positive results in 7 of those periods.
Conversely, the best return over the maximum number of positive periods reveals a buy date of September 14 and a sell date of September 23, producing a total return over the same 10-year range of 55.36% with positive results in 10 of those periods.
The buy and hold return for the past 10 years was 105.43%.
**Results shown are compounded
How to Invest
UBS E-TRACS CMCI Silver Total Return ETN (Public, NYSE:USV) – Info – UBS E-TRACS CMCI Silver Total Return is designed to track the performance of the UBS Bloomberg CMCI Silver Total Return, less investor fees. The CMCI Silver TR measures the collateralized returns from a basket of silver futures contracts. The commodity futures contracts are diversified across five constant maturities from three months up to three years. Expense Ratio: 0.40%
About Equity Clock
Equity Clock is a division of the Tech Talk Financial Network, a market analysis company that provides technical, fundamental and seasonality analysis on a daily basis via TimingTheMarkets.com andEquityClock.com. Equity Clock’s mission is to identify periods of reoccurring strength among individual equities in the market using methodologies presented by some of the top analysts in the industry, including that of Don Vialoux, author of TimingTheMarkets.com.
Feel free to use any of the content or seasonality studies (charts, timelines, or otherwise) presented as long as a link-back to this site at EquityClock.com is provided.
For further information on indicators used in reports presented on this site, please visit our reference page.


