

Big Moves Often Follow
Regular viewers of CCM’s weekly videos may be familiar with the expression “the longer a market goes sideways, the bigger the move you tend to get after a breakout or breakdown”, which aligns with the concept of periods of low volatility often being followed by big moves in asset prices.
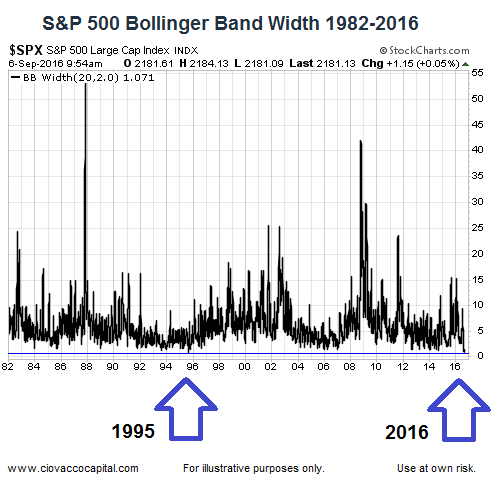
Lowest Level Dating Back To 1982
Bollinger band width is one way to track relative volatility. When Bollinger band width readings hit extremely low levels, it tells us to be open to a big move. The S&P 500’s daily Bollinger Band width has never been lower than it is today, using data back to 1982, which means a big move could be coming soon in stocks.
….related:
Michael’s Featured guest John Johnson, Chief Strategist of of Davis Rea – Be Really Careful Here


