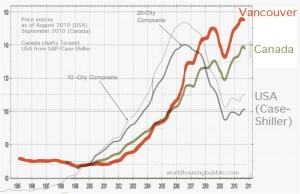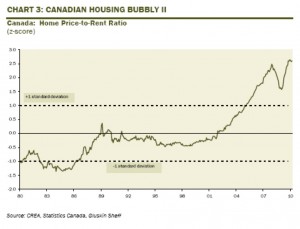
Does Canada have a housing bubble? It is a common question these days and based on some simple analysis of aggregate data on current prices versus long-term historical averages, rents and income the answer for certain markets would appear to be yes. However, there is considerable variation by local market as to the degree by which houses have deviated from long-term averages – a few more years of ZIRP by the Bank of Canada and that remains to be seen.
I would put limited credence on the metric most favoured by housing cheerleaders – affordability as measured by mortgage rates – as interest rates are at historic lows and ultimately a house is a long-term consumption good and long-term income levels must dictate prices.
House Prices versus Income (click on charts for larger version)
House Prices versus Rental Costs
House Prices versus Historical Averages
Of course some markets are better than others, but certainly the key, large markets seem stretched as can be seen in recent research by Demograhia:
“Historically, the Median Multiple has been remarkably similar in Australia, Canada, Ireland, New Zealand, the United Kingdom and the United States, with median house prices having generally been from 2.0 to 3.0 times median household incomes (historical data has not been identified for Hong Kong), with 3.0 being the outer bound of affordability. This affordability relationship continues in many housing markets of the United States and Canada. However, the Median Multiple has escalated sharply in the past decade in Australia, Ireland, New Zealand, and the United Kingdom and in some markets of Canada and the United States.
Housing in Canada is moderately unaffordable with a Median Multiple of 4.6 in major metropolitan markets and 3.4 overall. Housing was generally affordable in Canada as late as 2000. In the early years of the Demographia International Housing Affordability Survey, Canada was generally the most affordable nation. However, this year, Canada ranks third, behind the United States and Ireland.
Among major markets, four were moderately unaffordable and two were severely unaffordable. Among all markets, 9 were affordable, 17 were moderately unaffordable, 3 were seriously unaffordable and 6 were severely unaffordable. The four most unaffordable metropolitan markets were in British Columbia (Table 7).
Edmonton was the most affordable major market, with a Median Multiple of 3.5, while Ottawa-Gatineau had a Median Multiple of 3.7. Both of these markets were rated moderately unaffordable.
Canada’s most affordable markets were Windsor (ON) at 2.2, Fredericton (NB) at 2.4, Moncton (NB) at 2.5. Other affordable markets were Saint John (NB) and Thunder Bay (ON) at 2.6. Yellowknife (NWT) and Charlottetown (PEI) at 2.9 and Saguenay (QC) at 3.0 and Trois-Rivieres (QC) at 3.0.
Vancouver, which like Sydney has largely prohibited housing development on the urban fringe for decades, experienced a significant deterioration, with housing reaching a Median Multiple of 10.6, replacing Sydney as the second most unaffordable market in the Survey, following Hong Kong. Toronto was also severely unaffordable, at 5.5, a deterioration of 40 percent in housing affordability since 2004, as that metropolitan area’s “smart growth” program has taken effect. Montreal has been one of the worst performers in housing affordability, over the years of the Demographia International Housing Affordability Survey, with a Median Multiple of 5.1, up nearly 60 percent from 2004, at the same time as the land for development has been severely limited by an inflexible approach to agricultural zoning. Smaller British Columbia markets Abbotsford (7.0), Victoria (6.6) and Kelowna (6.6) were also severely unaffordable.”
House prices are highly mean reverting to median income and it is on that metric that most markets seem stretched. The timing and path of trend changes are always challenging to predict – are we facing an imminent and sharp price adjustment or a long, drawn out malaise. Perhaps the relentless upward march will continue?
Stephen Johnston


