

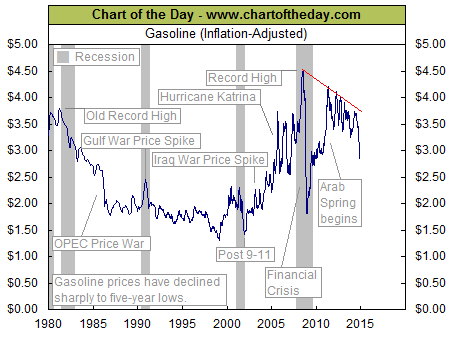
As a result of an overall sluggish global economy plus increased global supply, the price of crude oil continues to trend lower. Over the past seven months, the cost of one gallon of gasoline has declined a significant $0.88 (i.e. 24%). Today’s chart provides some long-term perspective in regards to gasoline prices by presenting the inflation-adjusted US price of one gallon of gasoline since 1980. There are a few points of interest. For one, geopolitical crises are often associated with major swings in the price of gasoline. It is also worth noting that, since the financial crisis, the resulting peaks of gasoline price spikes have been decreasing over time (see downward sloping red trendline). In the end, the recent plunge has brought gasoline prices to five-year lows..
Notes:
Where’s the Dow headed? The answer may surprise you. Find out right now with the exclusive & Barron’s recommended charts of Chart of the Day Plus
Quote of the Day
“My formula for success? Rise early, work late, strike oil.” – John Paul Getty
Events of the Day
November 27, 2014 – Thanksgiving Day
Stocks of the Day
— Find out which stocks investors are focused on with the most active stocks today.
— Which stocks are making big money? Find out with the biggest stock gainers today.
— What are the largest companies? Find out with the largest companies by market cap.
— Which stocks are the biggest dividend payers? Find out with the highest dividend paying stocks.
— You can also quickly review the performance, dividend yield and market capitalization for each of the Dow Jones Industrial Average Companies as well as the performance of the Dogs of the Dow.
Mailing List Info
Chart of the Day is FREE to anyone who subscribes. Just go HERE


