

Almost all the indicators of a toppy market haven’t presented themselves, writes a Charles Schwab pro.
One of my themes over the past few years is that the bull market that began in 2009 is of the “secular,” not “cyclical” variety. There are an increasing number of adherents to that perspective and it could help to explain, ironically, why there is also an elevated fear that this bull market is coming to a close. I say ironically because it’s precisely the increased optimism that has brought on fears of a bull market finale. I, too, consistently observe sentiment as a gauge for market behavior, but the growing cries that we’ve reached sentiment or valuation extreme worthy of past tops, or a bubble at its bursting point, seems a bit premature; even with the Dow hitting 16,000 and the S&P 500 hitting 1800 as I write this today.
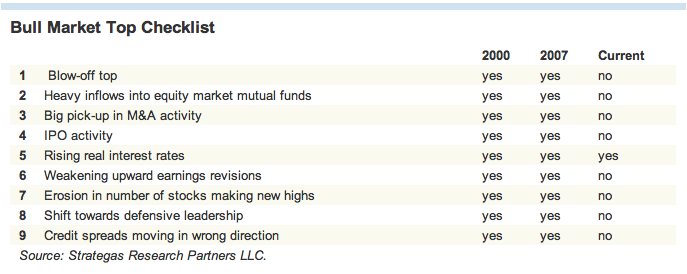
It’s instructive to observe past market tops and put them on the opposite side of today’s mirror. What you won’t find is a reflection. Our friends at Strategas Research Partners recently put together a brief table highlighting the factors typically in place at major market tops; all of which had kicked in at both the 2000 and 2007 tops. Of the nine factors listed, there is only one flashing red today: rising real interest rates.
Let’s start with the matter of rising real interest rates Such rising rates (real or nominal) are typically a bear market culprit, but today it’s a little different. Yes, real interest rates are rising; but mostly due to low and still-falling inflation; not sharply rising nominal rates. And, real rates are rising from record-breaking earlier lows. As we’ve argued for much of the past year, there remains a lot of wiggle room for rates to move higher before they begin to bite either the economy or stock market in a significant way.
I am by no means dismissing the possibility of a market correction, especially around the beginning of Fed tapering. Historically, corrections associated with the beginning of a higher rate cycle have been generally in the 5-10% range; and it may not be different this time around. But a normal single-digit correction is something entirely different than the end of a bull market.
Fund flows frothy?
The list above also has mutual fund flow data, which many are now suggesting represents a glaring warning signal. Yes, equity fund flows have picked up sharply this year; but the total barely makes a dent in the hundreds of billions that has come out of equity funds since the financial crisis in 2008. Not only that, but traditional pension funds are under-exposed to equities; hedge funds’ net long exposure remains below 50% (a very defensive position); and foundations’/endowments’ public equity exposure has dropped precipitously over the past decade in favor of alternative asset classes (that in many cases are underperforming traditional equities). So there isn’t really any investing cohort that’s gone hog-wild in equities.
I will point out one item on the list above- shift towards defensive leadership. This is one that bears watching given the pickup in relative outperformance of more defensive sectors recently. At this stage, it likely just represents more short-term defensive positioning around the recent fiscal uncertainty and also some value-hunting into year-end. But if the momentum carries into 2014, it’s one on the list that may have to be checked.
…..read page 2 HERE


