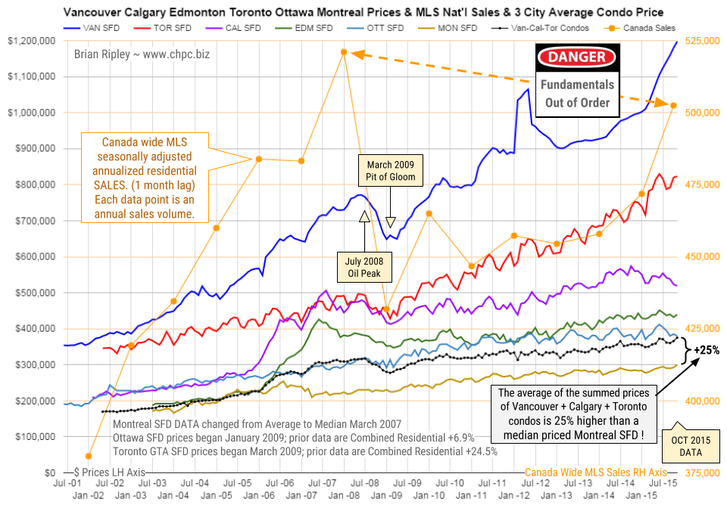
The chart above shows the average detached housing prices for Vancouver, Calgary, Edmonton, Toronto*, Ottawa* and Montréal* (the six Canadian cities with over a million people) as well as the average of the sum of Vancouver, Calgary and Toronto condo (apartment) prices on the left axis. On the right axis is the seasonally adjusted annualized rate (SAAR) of MLS® Residential Sales across Canada (one month lag)…..
….for more commentary and a much larger chart go HERE
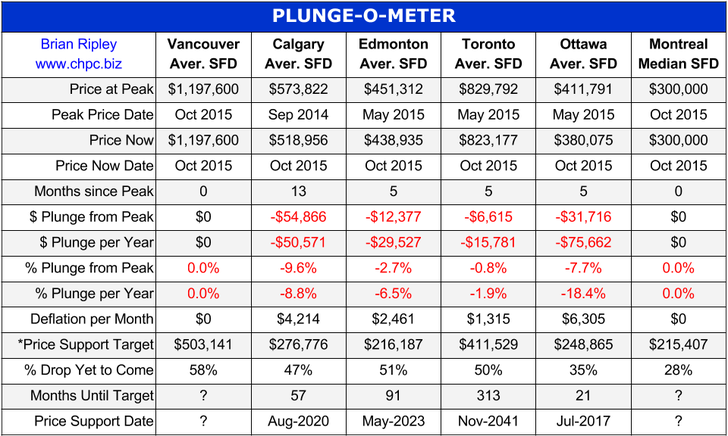
The Plunge-O-Meter below tracks the dollar and percentage losses from the peak and projects when prices might find support.