
Uncategorized

We are approaching the end of this current 8.6 year wave come June 13th 2011. What awaits us on the other side is a change in the overall trend. When we approached the same turning point in 1985.65, PEI took full page advertisements and ran them on the back of the English magazine, the Economist for 3 of the 4 weeks that month. Therein we warned that there would be a change back to inflation and that the steep economic decline that followed the insane peak in interest rates during 1981 was over. Now as we approach this same period after a tumultuous 4.3 years down that saw the collapse of real estate, the demise of legendary firms such as Lehman Brothers and a score of bankruptcies that followed, if anything, these past 4.3 years have certainly not been but boring. Many people lost their retirement savings or had them seriously curtailed. The involvement of group trading witnessed a catastrophic economic contagion that swept the world taking many countries down with it such as Ireland and Iceland. But these things are nothing new. The banks had to be bailed out on the loans to South America, Russia, Long-‐Term Capital Management, S&L Crisis, and now the Mortgage backed debt derivatives. Looking at their track record post 1971, one wonders if they ever get it right and they clearly all flock together magnifying their mistakes relying on the sure bet of government bailouts.
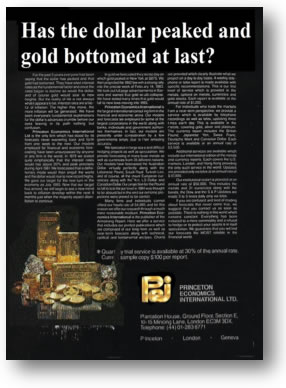
Our advertisement from the back page of the Economist in July 1985 was all about the coming change in trend. Curious, as today Standard & Poors issued a warning about the credit rating of the United States, there were difficult times back then as well. The dollar had risen so high the British Pound fell nearly to par and what would become the Euro fell to nearly 25 cents. The crisis was the trade deficit and the loss of jobs that government thought it could just manipulate the dollar and cure the problem.

The answer in government circles was to form the Group of 5 nations (G-‐5) known as the Plaza Accord for its location at the Plaza Hotel in NYC (Today G20). They decided that the five main countries would act as a group to coordinate intervention and force the US dollar down. They openly came out and announced publicly that they wanted to see the dollar fall by 40%.
The interesting aspect of these turning points has been the uncanny inflection point for change that manifests itself both in the perception of the people as well as in the halls of government. There is no question today that governments worldwide are very concerned about the debt. This is the final showdown that we face in this next wave of Marxist-‐Socialism v Liaise Fair Economics. In other words, will the markets force change to prevent the end of the world, or will government just run off a cliff? There is a choice, but nobody seems to be paying attention.
What is stunning, however, is the fact that Standard & Poors has even dared to issue a warning. Of course they are using the budget fight to scare the politicians. But everyone knows, there is no way they will ever downgrade US debt. Let us face the facts! If you always borrowed to pay off your old debt and just rolled it perpetually increasing your loans because of interest, then nobody would give you a credit rating worth anything and you might go to jail.
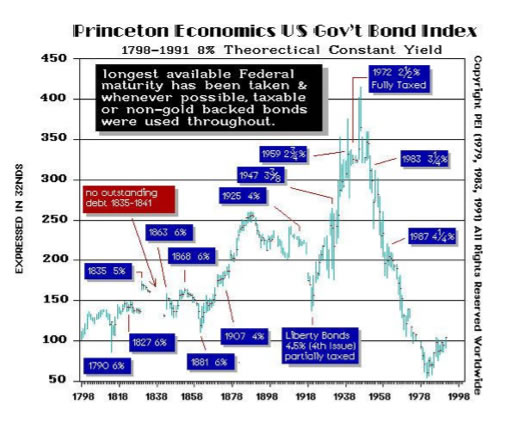
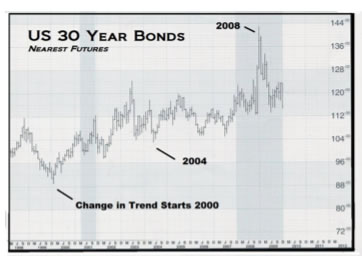
Above is a perpetual chart of US government bonds we use to publish. This is based upon a view of price rather than yield. We can see that just after OPEC began in the early 1970s, investing in US debt has been anything but a good long-‐term investment. But the cold hard face of reality, warns that no country’s offered a mirror image. Indeed, what prompted Standard and Poors to signal a danger to the credit rating of the United States was based upon IMF data showing the US deficit reached 10.6% of GDP. The US Congressional Budget Office puts that at 8.9%. Just as the Chinese Credit Rating Agency downgraded US debt and it was ignored saying “oh that’s China”, well the major credit rating agencies are American. Do you really think they would dare to downgrade US debt and live to talk about it?
Everyone was always looking at Britain warning they would be the next to default. The British deficit is 10.4% according to IMF data just behind the USA 10.6%. Even France is at 7%, Canada at 5.5%, Australia is 4.6% and Germany comes in at 3.3%. But these are ALL deficits as a percent of GDP and means there is no balanced budget and debt is continuing to escalate.
There is nobody with a balanced budget and nobody who is reducing the national debts. This means that the debt bubble is just going to grow larger and larger. There is no intent to actually balance the budget no less reduce its national debt. Thus, the problem is percolating as we enter this new 8.6 year wave. By the time we reach the end, well we should see the most interesting times separating a fool and his money.
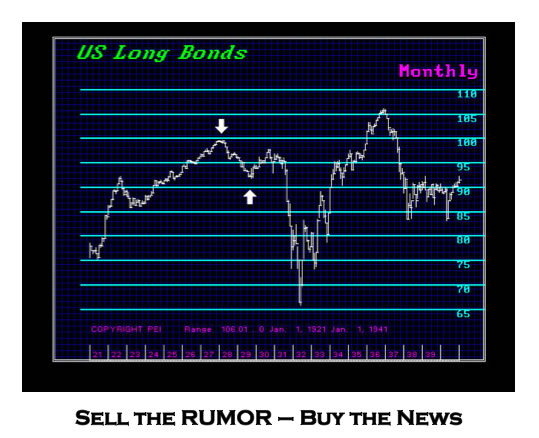
Here is a chart of the US Long Bonds covering the Great Depression and Postwar period. Notice that the bonds collapsed on fears in 1931 that everyone else defaulted on their national debts except France so it became widely anticipated the US would do the same. Clearly the Federal Government did not default. Nevertheless, as you can see, ANTICIPATION of a POSSIBLE risk of default wiped out the bond market purely upon expectations that did not materialize. And this was a period when the government was not in trouble and had chronic BALANCED budget surpluses. That is what prompted John Maynard Keynes to argue in times when DEMAND collapsed, government should take up the slack by deficit spending to stimulate that DEMAND.
There is always a dramatic difference between reality and possible reality. Something need not actually even materialize for you to suffer the effects. During the Great Depression, state and local municipals did get in serious trouble. The City of Detroit suspended payments on its debt, but resumed in 1963. So there were practical defaults that took place in the muni market.
As I have written before, it is ALWAYS the perception of risk that matters. The sky need not actually fall. It only has to appear as if it will collapse and that is enough to wipe your family out for generations. Indeed, the massive sovereign defaults of the 1931 Crisis left a group of little old ladies who always protested lending money to foreign governments into the 1970s. These were the children whose families suffered from the bond defaults.
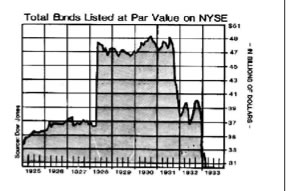
This graph shows the orgy of sovereign debt where foreign bonds were listed on the New York Stock Exchange. Just as we went through the mortgage backed securities crisis, the banks back then were selling foreign government bonds to the public in small denominations. It was the sovereign bond bubble that burst that time and it was the public that took it on the chin. But that had the side-effect of causing them to withdraw funds from the banks and we ended up with massive bank failures.
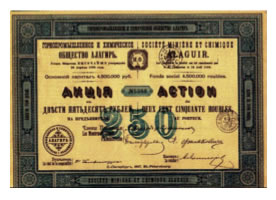
Bonds from South America, Europe, Russia and China all defaulted to the point you can usually find them for sale framed up from antique shops. This was a massive capital formation destruction that created the Great Depression more than any other element.
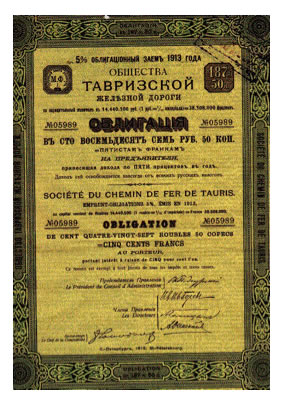
With each financial crisis there is always one element that attracts capital causing it to concentrate as that particular investment becomes popular. Each time caution is thrown to the wind. Just as the mortgage debt crisis took place with people talking themselves into the notion that some mortgages will default, but by pooling them together, the risk declines and the pool rises to the AAA status even though the component mortgages are B rated at best. Then they sliced and diced them according to risk. Back then, the sales pitch was similar in that these were sovereign nations. Well some at least look pretty when framed up. We use to have a bunch lining the hallways at our office to remind us what happens to the debt of nations. Just as they pitched the Russian bonds in 1998, the same was done in the 20’s. History repeats because mankind is just too stupid to learn from past mistakes.
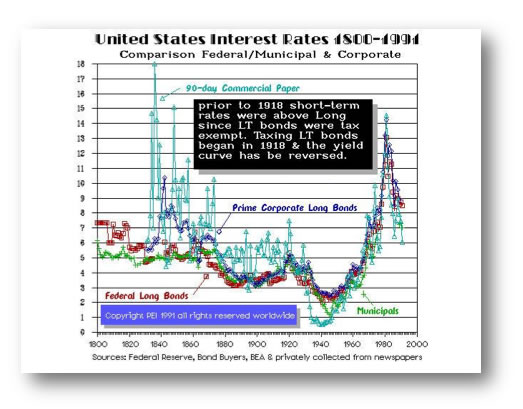
Here you will see the yields overlaid of the four primary general debt categories. We have the municipal and federal debt interest rates along with 90-‐day Commercial Paper and Prime Corporate Long Bonds. Note that the municipals were lower yields than federal in 1800 because the confidence back then was more in the state and local levels distrusting the new federal government. By the 1830s, you will see the introduction of corporate debt. There was the spike high with the Panic of 1837 and spikes with the Panic of 1857 running into 1873. This Panic of 1873 shifted the Financial Capital of the United States from Philadelphia to New York City. Now notice as the Great Depression manifested, the aftermath of the sovereign debt crisis brought with it a shift to corporate paper being viewed as safer. The 90-‐day commercial paper fell to the lowest rates of the group. Post World War II, the rates tended to converge with oscillation still evident.
As we move deeper into this sovereign debt crisis during the Next Wave, we will see the relationships evolve between these groups once again. That means we will see corporate paper become the preferred safe harbor for capital compared to municipal, state, and federal paper. The relationships all change.
What this chart clearly demonstrates is that NOTHING lasts forever. Everything around us is simply in a constant state of flux so that there is ABSOLUTELY NO RELEATIONSHIP that is permanent throughout history. This is the driving force behind what I refer to as CAPITAL CONCENTRATION. No matter what you look at, each sector and market gets its 15 minutes of fame.
The variables are extraordinarily complex. There are so many that exist that it␣s impossible to keep track of so many without a massive computing effort. It is just not so easy to break it down to a single cause and effect. Once a trend is set in motion, what we are looking at is a bunch of markets and indicators flipping so that the forecast for the long-‐term actually becomes easier than tomorrow. You can’t turn a battleship around like a speedboat. That is what the long-‐term becomes easier to see because it cannot change direction on a dime.
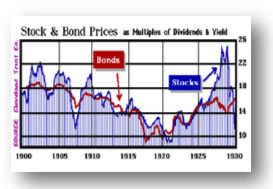
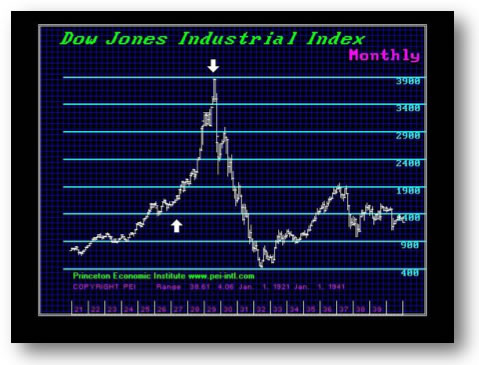
Here I have provided a chart covering 1900 to 1930 overlaying bond and stock prices as multiples of their respective yields. Notice that there was a surge in stock prices going into 1929 that created this huge spike attracting capital like a bug light. This is another trend that will emerge during this Next Wave when the public begins to figure out that stocks are the alternative to more risky bonds.
Looking closely at this chart reveals the spike swings over time. The sharp drop for the Panics of 1903 and 1907 are illustrated nicely, with the final low going into 1921 after the Panic of 1919. Once again, no relationship is ever stagnant. Everything fluctuates.
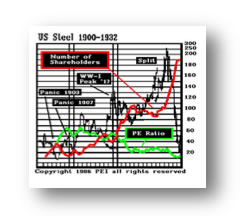
Additionally, here is a chart of US Steel a leading stock during the Roaring ’20s. Notice the ever rising red line reflecting the number of shareholders. This rises and the PE Ratio declines into the major high. Once more, this shows key trends that need to also be watched to distinguish big bull markets and shifts in domestic capital concentration.
Perhaps you are now getting a sense of what our model was tracking; EVERYTHING that ever moved. The economy is a vast complex and dynamically adaptive self-‐referral network interlinked on a global scale most have yet to fathom. If it moved, we grabbed it, threw it into the microwave to see what it would taste like. This was done on a massive global scale. We are far beyond RSI, moving averages, and stochastics here. Once you begin to see the dynamic structure, understanding how it unfolds is truly an enlightening experience.
In reality, there are correlations between many individual trends that are spectacular. You begin to see how groups really react and the trend unfolds before your eyes so you can see the future manifest in such a manner that there is no other solution. The future becomes verifiable as interrelated links confirm each other.
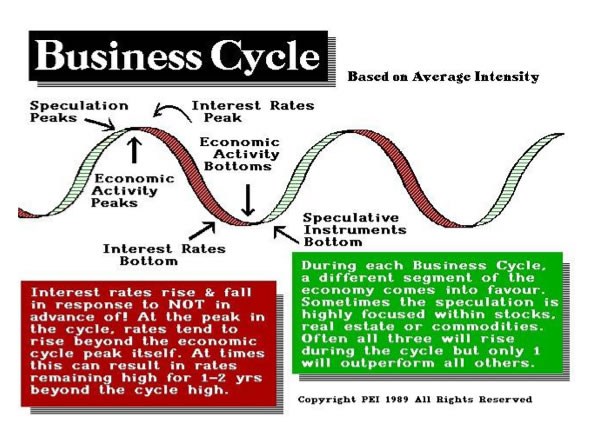
So we are approaching the nadir on the Economic Confidence Model. There is really no one Behind the Curtain who does not realize it’s a cycle. You probably can find an obscure book at the Foundation For the Study of Cycles by Paul A. Volcker, former Chairman of the Federal Reserve, entitled Rediscovering the Business Cycle published in 1978. So those who want to pretend cycle theory is somewhere out in left field, are either on a disinformation campaign or are really uninformed. The Bureau of Economic Analysis (BEA) seasonally adjusts data and that means they are smoothing the data to try to remove the spike highs and lows of the cycle.
Understanding that we face a very important change in trend on June 13th, 2011 (2011.45) is vital to our future. There is no chance in hell that everyone would ever follow one cycle. I personally believe it is a growing process. In our younger years, we take our losses and perhaps buy the high. After such a fiasco, we learn our lesson and become more cautious. A good trader values his losses more than his wins. This might sound stupid, but wins are a celebration, rarely time for reflection. A loss contains VALUE. You paid for it dearly. Learn why you made your decision and strive to implement that new costly knowledge. In this wave, we give meaning to that phase ␣ Ah to be young again; but with what I know today!
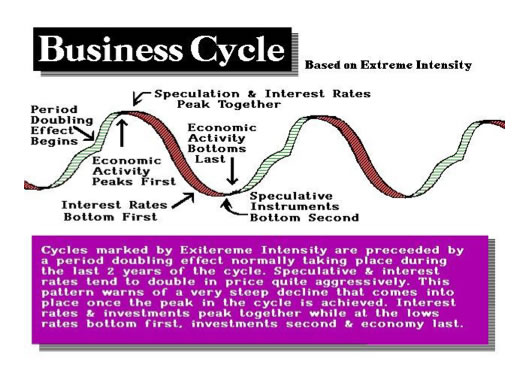
So what we have to comprehend is that as illustrated just above, there are normal business cycle patterns that are distinct with clear traits, and then there is the rogue tsunami wave. This is the wave that creates the Bubble Tops and reflects deep capital concentration. This is the wave formation that brings the house down. This is the wave that hit in 1929, and in Tokyo in 1989. It is the spike wave that is a PHASE TRANSITION whereby there is a price doubling in the last stage. We even saw this in gold and silver going into 1980. Gold rallied from $103 to $400 between 1976 and 1979. Then in the last few moments, gold blasted from the $400 level in December 1979 peaking at $875 on January 21st, 1980. We saw a similar pattern doubling in price in the Nikkei 225 in Tokyo.
These are patterns that are typical and universal. They are incredibly important to understand for they are the difference between emotional forecasts and real forecasting. If you do not have the experience, it is hard to see things rationally in times of such extreme price movements. At a seminar in Tokyo a private individual bribed hotel staff to get into our institutional conference. He later made his way up afterwards and told me how he got in and was desperate to ask me advice. He was in his 60s and had bought the Nikkei on the day of the high in 1989. He then told me he had NEVER invested in stocks his entire life. I was now captivated. I asked him why he bought on that day. He told me brokers had called him every year for the past 7 years telling him every January they market rallied around 5%. He said he watched their predictions every year pan out. So he gave in and invested about $50 million. The Nikkei fell about 40% and he still had the position because he kept waiting for it go back up to get out at a break-‐even. Those spike highs on this PHASE TRANSITIONS represent such highs because everyone who EVER thought about buying, has bought. There are no buyers left. Scare that herd, and you have a stampede that is unprecedented.
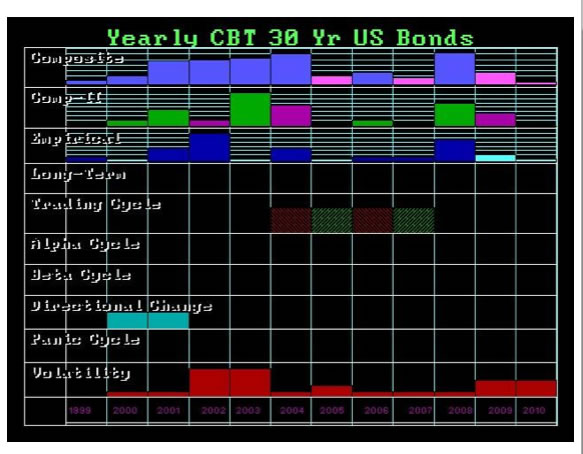
When we look back at the last forecast array generated by the computer, the top line is the composite of all the various models employed at the time. The main turning points were 2000, 2004, and 2008 when generated back in 1998. As we can see from the chart provided, these main targets were very critical. The 2002 high came in nicely on the Empirical Model and then the next strongest target back then appeared out 10 years forward in 2008. I have been asked: How can a computer project so far in advance? To answer that question, long-‐term trends are set in motion and become self-‐fulfilling for they are also self-‐referral drawing on the past. You simply cannot change the long-‐term consequences of accumulative actions over decades. We all know you cannot live forever on a credit card and never make payments or work. Governments are the same.
The Consequences of QE-2
No matter what people think, there are always two sides to every coin. The consequences of QE2 may indeed prove to be the same as those that have manifested from the Japanese government intervention that created: The LOST QUARTER CENTURY. While it may sound good to intervene and try to support the economy in periods of sharp decline, this type of action also has its negative side. What happened in Japan was outrageous. Indeed, the road to hell is paved with good intentions. This is what happens when the government believes (1) it has the power and (2) the obligation to intervene without any understanding of the consequences of its own actions.
Once a government intervenes, they are trying to manipulate the economy and markets. That CANNOT be done on a long-‐term basis. In Japan, the economy got worse because foolish corporations held on to their portfolios believing that the markets would not continue lower because of the government intervention. Had they simply liquidated their positions, the decline and fall would have been much shorter in duration just as the Great Depression. As illustrated above, there was no intervention DIRECTLY. There was manipulation of interest rates being lowered to try to stimulate demand and senate investigations that led to the creation of the SEC. But there was no DIRECT intervention as took place in Japan, Long-‐Term Capital Management (1998), or with TARP, and QE2. Direct Intervention appears to PROLONG the economic upheaval, NOT shortening it at all.
In other words, when capital realizes it is on its own, it deals with the consequences and moves on. Losses would have been taken swiftly and that beings about a faster conclusion to the outcome. I disagree with Alexander Hamilton that a National Debt is the price of Liberty, and I think this will be shown in the Next Wave.
DIRECT intervention has a nasty side-‐effect that does not appear on the warning label. As long as capital BELIEVES government is there to protect it, there is a tendency to jump in the back-‐seat and let them drive. Loses are held and that actually prolongs the economic decline.
QE2 side-‐effect is the impact it has had upon the real capital investment profile. Those who are in the KNOW, realize that QE2 has to come to an end. The fear of inflation rising as a byproduct of QE2 is widespread. Thus, there are two primary concerns that arise:
(1) Will the makes decline (particularly real estate) when QE2 ends for there is real doubt as to whether or not the actual bottom has ever been reached.
(2) What happens to the bond market when QE2 ends? If the Fed no longer supports the debt market and we return to having to rely upon the private markets to take up the debt, then we are once again betting on the fact that there will be buyers indefinitely into the future.
The primary unknown factors that REAL CAPITAL is concerned about BEHIND THE CURTAIN remain focused on the effects of QE2. For example, once QE2 ENDS, will the markets make new lows or is the worst truly past? What will happen if interest rates rise when QE2 ends? Will real estate resume the decline as was the case in Japan? What happens with the rolling debt going forward? If interest rates begin to rise AFTER QE2, will the National Debt then resume its rise as interest expenditure increase as a percent of total national debt? This would mean that all the efforts to reduce spending will be minimalized by the rise in interest expenditure. All the hype now will be just noise.
There have been some mind-‐bending shifts in the debt that bought us time and have contributed to pushing the real crisis off until 2016-2020. One of the primary factors that caused the National Debt to explore was the raising of interest rates into 1981 to affect inflation. The Fed’s theory on that score is brain‐dead. By raising interest rates to reduce demand makes sense ONLY IF the government is not the largest borrower. They reduced private demand, but accelerated the rise in the National Debt that transformed short-‐term inflation into a systemic inflation rate.
The statistics on the US National Debt show that the decline in interest rates has had a profound effect on buying more time. The lowering of interest rates to virtually zero, and the flight to quality that drove government short-‐term rates negative, allowed for reducing the debt as a percent of total accumulated interest expenditure. This has been largely overlooked. Money that would have gone to interest went to TARP. Nevertheless, this has purchased more time before the Sovereign Debt Crisis manifests, but it did not cure the problem since the interest expenditures now concern a largest debt historically. The upturn in rates rate will be devastatingly inflationary accelerating the debt even faster.
Additionally, the next aspect has been the percent of total debt attributed to the accumulative interest payments, which stood at 84.6% in 2007 and fell to 65.4%. This reflects the vast surge in the deficit to DIRECT intervention within the economy that has been unprecedented, and the lowering of the interest rates themselves. Thus, the surge in the debt was NOT caused by interest expenditure, but by stimulation.
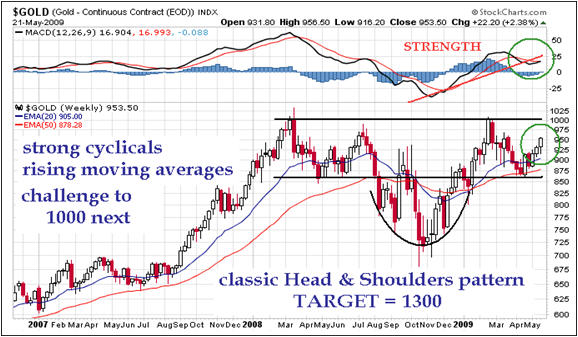
As we enter the Next Wave, these are just a few of the new factors that will be driving the forces ahead in the global economy. We must come to grips with these dynamic forces if we expect to understand the potential advances for the stock markets, corporate debt, and things like gold. There will be a lag in these shifting forces that will lead to confusion while the perpetual optimists will proclaim victory and argue once again for the demise of gold and the return to normalcy.
The big breakout in GOLD still does not appear to be now. The PHASE TRANSITION to exceptionally high prices will be in the NEXT WAVE, not the conclusion to this wave. We still face the readjustment in the economy and it will take some time just yet for the DEBT crisis to explode that appears 2016-2020.
http://corusmedia.media.streamtheworld.com/player/Player.htm?id=cknwam&city=Vancouver&bdskey=&url=http://www.cknw.com&platform=EMMISAM&active=true
Michael Campbell: Eric Coffin is of Hard Rock Advisories is with us now. He and his brother David have had a tremendous track record in looking at opportunities in the mineral market, the gold/silver market. Eric you were just in the big PDAC Conference (Prospectors & Developers Association) in Toronto. What’s the feel there? Is there tremendous optimism right now in that center.
Eric Coffin: It was the usual madhouse and even for the PDAC it was an unusual madhouse. One of Dave’s comments was that I think it was the second day it took him 40 minutes to get his coat out of the coat check. It was completely insane. It’s a very old conference and for most of it’s history it was really an industry conference, it wasn’t really an investment conference. That’s sort of been tacked onto it, and you see so many people coming from so many parts of the world now. There’s still a lot of fund managers, there’s still a lot of money that wants into this sector.
There’s a sort of old tale in the sector about the PDAC curse and the basis of that curse is simply that so many people try to get attention that the PDAC, that anyone that’s got any kind of interesting news puts it out right before the conference, so you kind of get this lull of news after it. So things might be a little bit quiet going forward, but certainly there are a lot of happy people. The guys who are the producers are just swimming in money, there’s going to be a lot of M&A. There’s already been a lot but there will be a lot more.
Michael Campbell: I would suspect that certainly seniors are looking to replenish some of their production, and of course it’s going to be pretty attractive to buy a smaller company who has already done all of the geological work and maybe need the financial. Do you suspect that that’s going to intensify then?
Eric Coffin: Yes I think it will. With the gold and other metal prices the price of buying those assets in the market has gone up. Big companies like to tell you that now they’d rather find the stuff themselves, but if you are at the scale of a Barrick or a Newmont, replacing your reserves every year and trying to put together a 15 or 20% growth rate is enormously difficult, and in fact almost impossible to do it unless you’re basically out on the M&A trail almost constantly.
Michael Campbell: Well one of the things that I find interesting is to know the process that they are undergoing to figure out assets that they think are worth acquiring because I’m not sure that it shouldn’t be exactly the same approach for what individuals are looking for. That’s what you do at HRA Advisory; you guys have been around a long time and you’ve been in a real salad days kind of environment here. You’ve had about 60 stocks from your list since 2003 when gold started to move, average gain about 250%.
What kind of companies is HRA Advisories looking for which would be very similar to what companies are looking for when they’re planing on purchasing whole companies?
Eric Coffin: There’s two or three areas we’ve been focused on lately; gold and silver obviously is one of them. You’ve got this sort of hierarchy of companies in all of the mineral sectors and different companies are looking for different things. Again, if you go back to a Newmont or a Barack, companies on a mass scale normally want production scale at a given mine. In other words, they don’t want to have to buy 40 mines to add a million ounces when they can buy three mines to do it. So generally what they want is scale, they want big, something that looks like it can produce 2 or 300,000 ounces.
That said, there’s a whole different tier of companies below that that are quite happy to go out looking for companies that can have deposits that can do 30 or 50 or 80,000 ounces a year. We look at both types and when you look at deposits the way to think about it really, the way these companies think about it, is it’s just how many ounces can they produce, and what is the margin on those ounces? So in other words a company that has a deposit that’s 23 million ounces and it looks like the economics are that they can produce gold at a cash cost of $800 an ounce, the company next to it might have two million ounces and maybe they can produce at a cash cost of $400 an ounce. Well obviously company X, the acquirer that comes along to look at these two companies, which one are they going to pay more for? They’re going to pay more for the one with the lowest cash cost.
So that’s the combination we like to see because those are the ones where you get the highest value per ounce. In this kind of environment with high prices a company that’s successful at adding and finding ounces in a deposit that looks mineable for 10 or 20 or 30 dollars an ounce can make a pretty good buck turning around and selling those ounces for $100 or $150 or $200 to a major.
The other area we have been looking at and spending a fair amount of time on is some of the commodities stuff; we’ve covered a few iron ore deals, we were really lucky with the Consolidated Thompson, we hit on that when things are really ugly in 2009 at about $2.5, it just got taken out at $17. We’ve got a couple of earlier stage companies that we’ve added just recently. Iron ore is very interesting, that is because it’s kind of the definition of how different this sector is in this kind of a secular bull market; 10 years ago, 20, 30, 40 years ago you simply would not have seen juniors going after iron ore deposits, it just never happened. And the simple reason for that was it all but impossible for a company of that scale to go in and prove one of these billion ton deposits and have any hope of ever putting into production, because there was just no way they could make that leap in financing.
In fact, that’s what Consolidated Thompson did, it put a deposit in production at eight million tons a year, and that kind of scale, that kind of revenue generating at today’s iron ore prices eight million tons a year you’re looking at over a billion dollars a year in top line revenue, that’s what the really big guys look for, that’s what they want. They want to buy things that can add substantial revenue to balance sheets and income statements that are already pretty huge. So the bulk commodities are pretty interesting to us, and they look like they’ve got legs now. We’re looking at a lot of stuff in the agricultural space, basically fertilizers, potash, things like that. And again, they have scale potential and we think that’s a story that’s not going to go away. With the wealth increase you’ve seen across the world one of the side effects, and it’s not really a good one, is that food prices have gone up a lot but as those prices for basic foods go up there is more room for farmers to maximize productivity with things like fertilizers. So we think the market is like that so it’s going to stay good for quite a while.
Michael Campbell: HRA Advisories is looking for opportunities throughout the world and that’s what I wanted to get to: how do you factor in geographical risk when you are looking at something Eric? It would seem to me that Canada and North America are in the cat-bird seats, South America has been a little iffy in certain countries, and I wanted to ask you about Africa. There’s some hot areas in Africa but should I be concerned as an investor about the geopolitical risk?
Eric Coffin: Africa is a tricky place, there’s a lot of different countries, a lot of them aren’t particularly stable, most of them aren’t democracies in any real sense of the word. There are areas that we like, we like West Africa in particular, most of the countries there are to some degree, and to a large degree in many cases democratic; they’ve been fairly stable, they don’t have a lot issues in terms of boundary issues between each other so you’re not getting those kinds of problems which are pretty common throughout Africa. It is an area that’s pretty welcoming when it comes to foreign investment. It doesn’t have a lot of really strong native industry that generates a lot of wealth, these are mainly pretty poor countries, and in their case most of these countries I think recognize that mining has been a really good thing for them, the gold sector in particular. It’s really quite amazing how much difference gold production has been able to make in some of these countries.
West Africa’s gold production has gone up about 70% in the last ten years, it’ll go up another 40 or 50% probably in the next five years. If you look at a country like Burkina Faso which is one country where we cover a couple of companies in, that’s an increase from essentially a standing start a few years ago. We were talking about adding 20 or 30% to their GDP just out of the mining sector and by local standards these are very, very high paying jobs. Plus these companies are going to be contributing a very large percentage of the tax base. So the countries are very much pro-mining, there’s lots of alluvial miners there so it’s not like something they don’t really know about. And if you look at what’s developing there’s one thing that’s interesting about West Africa. The rocks are basically the same as central Canada, very old greenstone rock. In West Africa’s case they haven’t been shaved off by glaciers 20 times so there’s lots more oxidation. Almost all the work done there in the past was very shallow drilling to drill of oxide deposits that would go into heap leaches; most of the mines right now are heap leaches.
What you are starting to see companies do and one example I’ll give you is Riverstone, a company that everybody probably knows that we follow, Riverstone has been drilling at their main project called Karma that’s got three different deposit areas in it. They just put out a new resource which was about a 70% increase, it’s gone from 1.1 to 1.9 million ounces that doesn’t include the last 30 or 40,000 meters of drilling. What you’re just starting to see them do now is drill below say 100 to 150 meters of depth. They’re going from the oxide down into the transition and the sulphide zones. In the past, companies would just basically stop when they started hitting sulphide. But one thing that’s changed with $1,400 gold is these companies can start looking at these deposits and saying: you know what, at these gold prices we can go in, build a plant, not just a heap leach but a mill, and start going after this one gram, one and a half, two grams stuff in sulphides and make really good money at it.
Another company we follow also in Burkina Faso called OreZone had a big jump a few months back and largely what they did was drill deeper and start including sulphide resources and I think you’re going to see Riverstone do that moving forward. You’re starting to see a lot of the companies there push their drilling deeper and I think what you’ll see is a lot of deposit enlargement over the next little while. A lot of these half a million/million ounce deposits have got room to go to a million/two million ounces. And the other thing that will happen in many cases you’ll see the grade go up because in a lot of these deposits the sulphide zones are actually higher grade than the oxide zones, the problem is sulphides are a little harder to get out. But at these gold prices, it’s worth doing and I think you’re going to see the gold. I think the 50% increase in gold production over five years, it could even be more than that, there’s a lot of deposits in that areas that are just getting drilled off. It’s a great area to be looking.
Michael Campbell: I’m talking with Eric Coffin, Hard Rock Analyst Advisories and by the way I want you to do this, go to www.moneytalks.net and you’ll see on the front page there it’s Africa gold week as we’re having a look at that particular area in a variety of ways. There’s a ton of producers that you will recognize names of in different areas; Harmony Gold or Plascer Dome has big areas down there, Gold Fields is a company that I have been in and out of for years. So there’s lots of companies that you know, but there’s also a very vibrant area for growth. Africa I think accounts about 30% percent of production right now in minerals.
Let me just ask you this Eric: with higher gold prices obviously a lot of different techniques and different properties become much more viable when you can get $1,400 an ounce and a cost basis at say $800, you can make a go of it; obviously if prices were lower for gold you wouldn’t be able to. But I want to ask: this whole area, is that really where the big action is going to be if you can choose the right properties?
Eric Coffin: I think that’s true. I know you talk to people on shows like this and you talk to people at conferences and people are a little frustrated with the majors, and there’s nothing wrong with them but one trend that we’ve noted over the past year/year and a half is you are seeing, and I’m talking gold producers here in particular, their PE ratio has declined over the last little while. It used to be that gold producers got outrageous PE ratios and held them for years and years, and part of the reason for that I think was people were buying it for the ounces in the ground on the assumption that you would make money on increases in the gold price and I think as the gold price has gone up you’re starting to see that premium come off of the producers.
So it’s a little harder for them to just get big leverage incremental gains from moves in the gold price. The big incremental gains come from basically investing in companies that find something and grow those resources and go from having no ounces in the ground to a million ounces in the ground. In percentage terms that’s where the big money is. It’s riskier obviously but I think if you can pick things that are already on that track and look like they can build resources they already have I think you can do very well at that end of the space. And there’s been so much money going into the juniors in the last six to eight months, there’s a lot of companies out there that are still juniors but they’ve got 10 or 20 or $30 million, they’re not going to run out of money or have to go back to the market any time soon.
I’ve just got a minute or two left here Eric. If you can just throw a couple of names out. If you can just give us a couple of names that maybe we can put on our radar screen?
Eric Coffin: Riverstone Resources is certainly one of them, they’ve got 1.9 million ounces now, it’s not expensive at all compared to its peers, and they’re still drilling. There’s going to be more ounces, they’ve already got more ounces in the can if you will and that they’re going to be drilling pretty much continuously through to the end of the year.
Another one that we’ve followed from much cheaper prices but still like and that you should have on your radar screen is the company East Asia Minerals and the reason for that is there’s two things coming in the short term: one is their first resource estimate, your guess is as good as mine but I’m thinking probably in the four or five million ounce range. But they’re also doing a transaction where they’re going to spin off a couple of new companies and both of these companies will actually have a million ounce plus gold resources in them so it’s going to be like a three for one…but the actual details will be announced I think in the next two or three weeks in terms of what the ratios and stuff will be. I’ll be keeping an eye out for that.
A couple of earlier stage ones that we follow, one is called Gold Quest, they’re down in the Dominican Republic. I‘d have that one on your screen because they should have a small gold deposit down there of about 400,000 ounces, they’re drilling that right now, shallow. In January they had some really nice drill results the last time they drilled it; they should have that first set of drill results from this drilling coming out probably in the next week or two I would think, and if they can recreate some of the best holes from the last one I think that one is going to probably really get some action.
And the whole Yukon play, we were surprised how much a lot of these stocks went up in February. We’d be calling an area play for a year and a half and we didn’t expect a lot of weakness, but a lot of the discovery stocks actually saw 52 week highs in February which is pretty amazing for Yukon explorers, there’s no news coming for months. But I certainly keep that area on the radar screen. One that’s a little earlier stage called Northern Tiger which we like, it’s another high grade story. Again, none are going to be generating actual drill hole news for at least a minimum of a couple of months, three or four months in some cases. But now is the time to get them on the radar screen and kind of pick your spot, and maybe pick up some cheap as the summer work starts.
Michael Campbell: Thanks Eric. Listeners, if you’re serious about investing in this area, Hard Rock Advisories is actually one of the most respected services for the depth of their research and that’s why we’ve got a special on www.moneytalks.net, go to www.moneytalks.net on the front page you’ll see African Gold Week. Click on that and just on the right you’ll see a special offer for HRA Premium Services. I think as I say you get Eric and David Coffin and people that they use on a full time basis looking for these opportunities. It’s a great deal: www.moneytalks.net; just click on African gold week and you’ll see the offer right there on the right hand side.
West Africa is literally elephant country for gold mining – hosting world-class gold deposits in Ghana, Mali and Guinea that include Obuasi (past production and current reserves of 42 million ounces), Bibiani (5.0 million ounces), Syama (5.2 million ounces), Morila (5.9 million ounces), Sadiola (14 million ounces) and others. In addition, West Africa has had the fastest growth in gold production in the world over the past five years.
Burkina Faso accounts for 21% of West Africa’s Greenstone Belt Exposure. This mineral potential is being investigated by a number of mining companies, some of which are outlined HERE
Burkina Faso is a politically stable country adjoining Ghana and the belts of favorable rocks that host all of the major gold deposits in Ghana continue on into Burkina Faso. While Ghana’s well-documented exploration successes have resulted in a scarcity of available geological prospects, some area’s of Burkina Faso have been severely under-explored.
Some of the most important types of gold deposits in West Africa are shear-hosted vein deposits which occur in Birimian Greenstone Belts, composed of Lower Proterozoic volcanic or volcano-sedimentary rocks. This geological setting is analogous to the prolific Precambrian gold belts of eastern Canada and other parts of the world; however, West Africa has received only a small fraction of the exploration coverage that those other belts have experienced. In particular, Burkina Faso has undergone less than 10 years of modern exploration, starting in the mid-1990s, with little activity occurring between 1999 and 2003. It thus remains under explored even in comparison to neighbouring Ghana and Mali, which both host world class gold mines in the same belts of Birimian rocks. Therefore, management believes there are compelling opportunities for further major discoveries in this region.
….read the full report on West Africa HERE
-
I know Mike is a very solid investor and respect his opinions very much. So if he says pay attention to this or that - I will.
~ Dale G.
-
I've started managing my own investments so view Michael's site as a one-stop shop from which to get information and perspectives.
~ Dave E.
-
Michael offers easy reading, honest, common sense information that anyone can use in a practical manner.
~ der_al.
-
A sane voice in a scrambled investment world.
~ Ed R.
Inside Edge Pro Contributors

Greg Weldon

Josef Schachter

Tyler Bollhorn

Ryan Irvine

Paul Beattie

Martin Straith

Patrick Ceresna

Mark Leibovit

James Thorne

Victor Adair