
Marc Faber : Well, I mean, you know, I’ve learned that what I know I obviously learned from someone. I didn’t invent it. So I worked at White Weld with Gary Schilling and he’s a friend of mine; I see him occasionally at the conferences and so forth. And I disagree with him about that we have deflation. He lives in New Jersey. I went to New York airport the other and day and then I drove to New York City and the Lincoln Tunnel fee has just increased from $8 to $14. Well, I’m sorry, that is a 50 percent increase. And so there is no deflation in the system today. But if you say there is deflation in the housing market, yeah, there has been deflation in the housing market and if you ask me will there be one day a deflationary collapse, yes, one day there will be a deflationary collapse, but you understand, as an investor it’s nice to say there will be a deflationary collapse, but it could happen from Dow Jones 100,000 or gold price 20,000 or from home prices that are much higher than today and from a dollar that has depreciated much more than is the case today. So the difficulty for the investor is actually to navigate between today and the time of collapse that I think is inevitable. But how do you protect your wealth in the meantime and in the time of collapse? Investors, and I think they have to begin to think about this already today and say, okay, what does it mean if there is a global kind of deflationary collapse. In a deflationary collapse, everything essentially goes down in value, but obviously, like in an inflationary boom, in an inflationary boom you have different assets that go up at different times with different intensity. So let’s say if you look at 2000 to today, you were better off in gold and commodities than in equities. Now, in a deflationary collapse, the key is to say, okay, I’m only going to lose 50 percent when everybody else will lose 90 percent. So relatively speaking, I will be much better off. And that is the strategy that investors should consider: How to position themselves to lose less in the deflationary collapse in the final crisis than the majority of people. Then relatively to other people, their position will improve.- 06 Apr 2012
Timing & trends
By: Andre Gratian
SPX STILL IN CORRECTION MODE
Precision timing for all time frames through a multi-dimensional approach to technical analysis: Cycles – Breadth – P&F and Fibonacci price projections and occasional Elliott Wave analysis
“By the Law of Periodical Repetition, everything which has happened once must happen again, and again, and again — and not capriciously, but at regular periods, and each thing in its own period, not another’s, and each obeying its own law… The same Nature which delights in periodical repetition in the sky is the Nature which orders the affairs of the earth. Let us not underrate the value of that hint.” ~ Mark Twain
Current Position of the Market
SPX: Very Long-term trend – The very-long-term cycles are down and, if they make their lows when expected (after this bull market is over) there will be another steep and prolonged decline into late 2014. It is probable, however, that the steep correction of 2007-2009 will have curtailed the full downward pressure potential of the 120-yr cycle.
SPX: Intermediate trend – The intermediate uptrend is still intact, but a short-term top is already in place.
Analysis of the short-term trend is done on a daily basis with the help of hourly charts. It is an important adjunct to the analysis of daily and weekly charts which discusses the course of longer market trends.
Daily market analysis of the short term trend is reserved for subscribers. If you would like to sign up for a FREE 4-week trial period of daily comments, please let me know at ajg@cybertrails.com”>
Market Overview
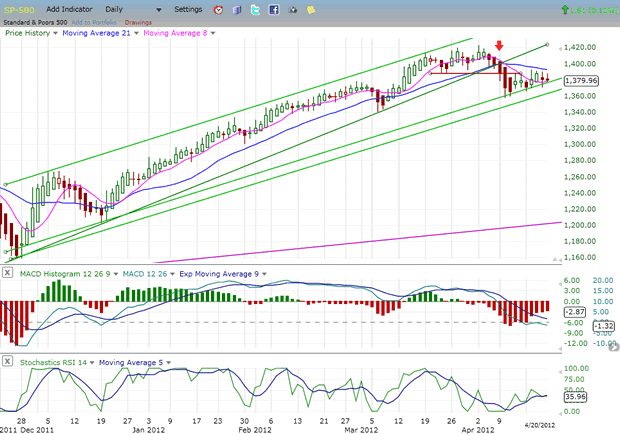
The SPX remains in an unconfirmed short-term decline. It will be confirmed when it trades lower than the recent 1357 low. Until it does, there is a possibility that the index is making a consolidation pattern in preparation for continuing its bullish uptrend.
I rate the odds of that possibility as very low. On the Point & Figure chart, the trading pattern which resulted in a high of 1422 is clearly a distribution phase which stands unresolved in spite of the drop to 1157. In order to fully unleash the potential that was built up during these 4 weeks of distribution, the SPX would have to drop to 1342 at a bare minimum, most likely to about 1300, and perhaps to as low as 1345. The stock market moves forward in a continual process of accumulation-uptrend, distribution-downtrend. Each period of accumulation and distribution stores energy which is released in the following move. This happens in all time frames and is one of the basic structural mechanisms by which the stock market progresses.
When the SPX dropped below 1393, it broke below a support level that has now become a strong resistance area, and which it has tried unsuccessfully to overcome for the past two weeks. During this time, the index has constructed what appears to be another phase of distribution which closely resembles the one formed at the higher level, and it looks nearly complete. If that’s the case, the decline which started from 1422 is about to resume. The next few days of trading should be decisive.
There is an important cycle bottoming at the end of the month which should play an important role in the near-term market action as it applies more and more downward pressure with each passing day. Since the beginning of the bull market in 2009, like clock-work it has brought about a significant decline in the stock market when making its low. It would be more logical to expect a recurrence of that pattern than to ignore it. Its last bottom came in early October of last year in conjunction with the 3-yr cycle, and it is again due at the end of April.
If the current market activity is being interpreted correctly as a corrective pattern which is almost complete, the resumption of the decline should occur during the coming week.
Chart analysis
We’ll start with the Daily Chart of the SPX. Let’s first look at the structure. From the 1159 low in November of last year, the index progressed to 1422 in what appears to be 5 waves before breaking its trend line in early April. This caused a decline to 1357 and to the bottom of the rising channel in which it is still confined. Until it comes out of that channel on the downside, the SPX is still in an uptrend.
Instead of rebounding smartly, as it did the last time that it touched its trend line before breaking it, the price activity for the past two weeks has consisted of crawling along the bottom channel line. This is not a strong pattern! This crawling action, more often than not, results in a break of the trend line which is acting as support, and in a continuation of the downtrend.
To Read More CLICK HERE

“The question is not whether this is a correction, the correction has got underway. We may easily have a correction of 10% to 20% here.”
also:
Marc Faber : There is no Deflation in the system today except in the housing market
Quotable – “The darkest places in hell are reserved for those who maintain their neutrality in times of moral crisis.” – Dante Alighieri
Commentary & Analysis
[Warning: I am feeling a bit dark this week. So if you want to join me in depression, feel free to read. Otherwise, skip this one. Thanks. Jack]
I finally figured it all out. Our global policymakers are nothing more than Wizard of Oz aficionados (the movie as the book is way over their collective heads). They just love happy endings. Let’s just get all the little people to follow down the yellow brick road and it will all turn out just fine, our pols want to believe.
Of course our politicos’ fairy tale is validated each day by those they love the most–the big people leading us down this path–financial types (defined as anyone who benefits from the financial world, not the real world). It is what it is. Big people are big for a reason. And the big people want that path paved with yet another layer of green paper. Simple!
What is this talk of recession, say the big people? And they say it with their Super Pacs and $40,000 –$50,000 a plate dinners to help elect the top Republicans and Democrats (read totally vetted shills who pledge behind closed doors to keep the status quo the status quo; nothing more than different colored horses from the same stable it seems to me). After all, the financial economy is doing just fine; great in fact, is the refrain from Mr. Financial Big Whig.
But even Mr. Financial Big Whig has a few laments: 1) The price of houses in Greenwich or London; 2) His driver’s parking problems in Davos last year; and 3) The damn 5-minute wait in line at the lift in St. Maritz. What is this recession crap?
I asked JR yesterday (as we watched the local news of Mitt Romney in Palm Beach for a reported $50k a plate stop-over); who is more sickening, the shills panhandling for $40-50k a pop or the crony-istic dregs who actually pony up that much? Decisions, decisions….
To say it is a bifurcated world culturally and materially is to understate the obvious. It is bifurcating down the path of the financial economy versus the real economy, to a large degree. [And if you read Charles Murray’s new book, you get a very bad feeling in the pit of your stomach as to where this is leading.]I realize it is what it is and always has been. But watching it all play out so transparently with such hubris flowing from the top makes it that much more revolting. For example, a bit off point, but if are disgusted with US politics, you have to be stunned to watch the US State Department chastise other countries about the need to “improve their election system”? What a farce! Sorry. These dark thoughts creep in whenever I consider hedge fund managers and pols in the same sentence.]
Back to point, assuming I have one here. Joseph Goebbles would be proud of our central banking wizards. Goebbles, the Nazi propaganda chief, understood the big lie told again and again will sooner or later be believed as truth. All Pols follow this theory. But even Goebbles would be stunned to see how often the Big Lie is used by central banks as the truth stares everyone in the face; the face of those who know how to find US Banking Reserves as listed by the St. Louis Feds research department:
1. If Fed liquidity worked the US would be in the midst of the biggest post-recession boom in history. Instead, we are in the slowest post-recession recovery since Stalin-loving Roosevelt stacked the Supreme Court. Let’s let the reserves speak once again for themselves:
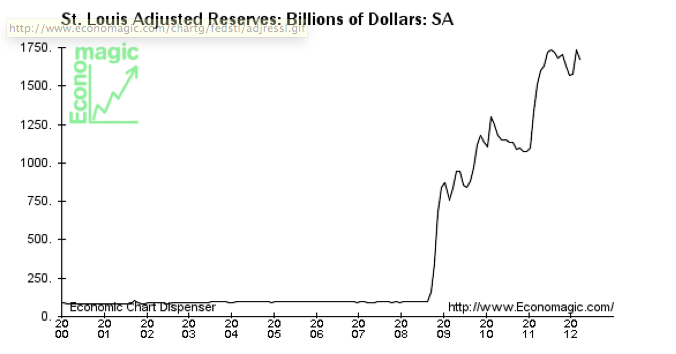
If real growth is taking hold, we should have seen a fall in all these reserves sitting on bank balance sheets.
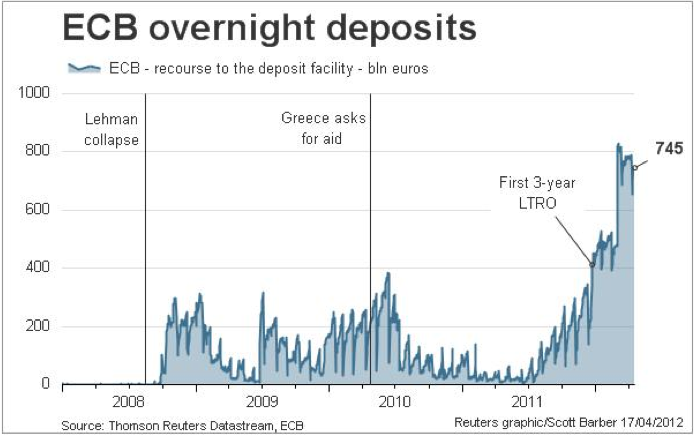
2. Déjà vu all over again from the ECB. Gee, it did nothing for the US real economy, so why don’t we try it here in Europe, say the Wizards running the European Central Bank (ECB).
The argument to my rant is obvious: So what would you do Jack, let the banking system go bankrupt? Well, yes I would, thank you for asking. One by one and every stinking banker who led his firm down the prim-rose path of derivatives would be history. Super-regional managers would step up to the plate and take their turn. After all it is the regionals and local banks that really know what banking should be anyway…credit and relationships. It isn’t rocket science. [Just look at how massively the powers-that-be, pols and their handlers in the banking system, have attacked Paul Volcker’s very good ideas of what banking should be. Nothing has changed!]
There’s an evenin’ haze settlin’ over town Starlight by the edge of the creek The buyin’ power of the proletariat’s gone down Money’s gettin’ shallow and weak Well, the place I love best is a sweet memory It’s a new path that we trod They say low wages are a reality If we want to compete abroad
My cruel weapons have been put on the shelf Come sit down on my knee You are dearer to me than myself As you yourself can see
While I’m listening to the steel rails hum Got both eyes tight shut Just sitting here trying to keep the hunger from Creeping it’s way into my gut
Meet me at the bottom, don’t lag behind Bring me my boots and shoes You can hang back or fight your best on the frontline Sing a little bit of these workingman’s blues
Well, I’m sailin’ on back, ready for the long haul Tossed by the winds and the seas I’ll drag ’em all down to hell and I’ll stand ’em at the wall I’ll sell ’em to their enemies I’m tryin’ to feed my soul with thought Gonna sleep off the rest of the day Sometimes no one wants what we got Sometimes you can’t give it away
Now the place is ringed with countless foes Some of them may be deaf and dumb No man, no woman knows The hour that sorrow will come
In the dark I hear the night birds call I can feel a lover’s breath I sleep in the kitchen with my feet in the hall Sleep is like a temporary death
Bob Dylan, Workingman’s Blues
At some point, this game must end. The financial world CANNOT continue to widen its gap with the real world ad infinitum. Sooner or later, I think we will learn the path to hell, not Oz, is indeed paved with green paper.
Jack Cooks Black Swan www.blackswantrading.com Currency Currents Blog
Black Swan Capital’s Currency Currents is strictly an informational publication and does not provide personalized or individualized investment or trading advice. Commodity futures and forex trading involves substantial risk of loss and may not be suitable for you. The money you allocate to futures or forex trading should be money that you can afford to lose. Please carefully read Black Swan’s full disclaimer, which is available at http://www.blackswantrading.com/disclaimer

For the past couple of months I’ve been anticipating that the rally in “risk assets” would run out of steam but I have been waiting for confirmation…I think we are seeing that confirmation over the last two weeks or so…trade accordingly.
Over the past couple of years I’ve frequently asked the question, “What are we trading?” And my answer has been “perceptions of central bank liquidity.” I think the rally in stocks since the lows of Oct 4 has been fuelled by liquidity injections from the G4 (US, Euro, UK, Japan) and by anticipation of more liquidity injections to come. These injections have created false optimism in the markets.
The LTRO injections in the Euro zone in Dec and Jan created a “Lull” in the Eurozone bank/sovereign debt crisis….it appears the “Lull” is over as yields rise on the weaker credits, Spain in particular. I think we will see stress build in Europe in reaction to austerity programs, weak economies, elections, and high unemployment. The weaker Euro countries are headed into a vicious cycle of faltering economies and higher interest rates. Social unrest will rise, populist politicians will call for “re-negotiations” and possibly a withdrawal from the Euro.
The S+P 500 and the DJI made a “M” double top around the end of March/early April with (very nearly) perfect weekly key reversals down last week…both have fallen ~3.5% from last week’s highs to today’s close.
The psychology change this past week was interesting. Stocks fell sharply on Monday in response to the weaker-than-expected UE data released on Easter Friday. On Thursday, stocks rallied sharply on anticipation of fresh Fed liquidity injections (two Fed Governors made dovish speeches) but today those gains were reversed as the Euro crisis moved back to centre stage.
To Read More CLICK HERE
![]()
By: Guy Lerner
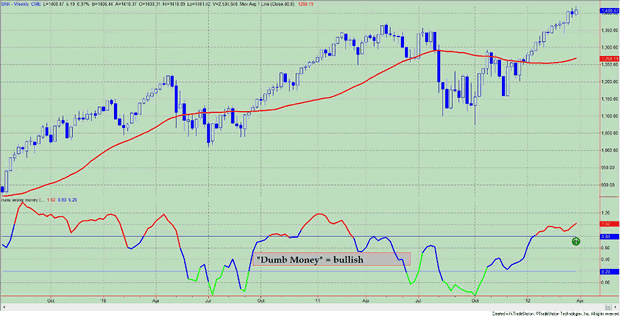
For weeks now, I have been using phrases in these weekly articles on sentiment like “the best, most accelerated gains are behind us” and “we are closer to the end then the beginning”. When we look at the charts, the SP500 has been essentially flat for the past 8 weeks, so every now and then, I guess I can get it right. If you have been a buyer over this time period, you most likely will find your investment underwater. In other words, there are a lot of investors who have bought high with the expectation of selling higher and who have bought the Wall Street nonsense that this is an investing opportunity of a lifetime. NOT! The “dumb money” indicator has dropped below the upper trading band (see figure 1, green arrow), and the best time to sell is usually 1 week after this signal. There are other scenarios that could develop, such as the emergence of the dip buyers leading to excessive speculation, but the most likely scenario and until further notice, I would be a seller at higher prices. The gas appears to be coming out of this market.
As the current market environment has been compared to 2011, it is noteworthy that last year’s sell signal occurred on March 11. 7 weeks later the market made a marginal new high in another flurry of speculation. It took the market another quarter before it actually cratered sustaining a 20% loss over 4 weeks. In general, the next best buy signal will occur when investor sentiment turns bearish.
The “Dumb Money” indicator (see figure 1) looks for extremes in the data from 4 different groups of investors who historically have been wrong on the market: 1) Investors Intelligence; 2) MarketVane; 3) American Association of Individual Investors; and 4) the put call ratio. This indicator is now neutral. The data shows that the optimal sign to sell is 1 week after the indicator crosses below the upper trading band. But these are optimal scenarios, and I should caution that optimal and stock market are rarely spoken of in the same sentence. The market is just too unpredictable. Who saw the May, 2010 “flash crash” or the 20% drop over 3 weeks in 2011 coming? If you hang around too long, you could be one of those casualties. Alas, there are no right answers or guarantees. These are just signposts that help us better understand the price action.
To Read More CLICK HERE
Figure 1. “Dumb Money”/ weekly

-
I know Mike is a very solid investor and respect his opinions very much. So if he says pay attention to this or that - I will.
~ Dale G.
-
I've started managing my own investments so view Michael's site as a one-stop shop from which to get information and perspectives.
~ Dave E.
-
Michael offers easy reading, honest, common sense information that anyone can use in a practical manner.
~ der_al.
-
A sane voice in a scrambled investment world.
~ Ed R.
Inside Edge Pro Contributors

Greg Weldon

Josef Schachter

Tyler Bollhorn

Ryan Irvine

Paul Beattie

Martin Straith

Patrick Ceresna

Mark Leibovit

James Thorne

Victor Adair