
Stocks & Equities
 The sky is falling.
Investors are panicking.
But the market?
The S&P is down about 2.5% from its August 2nd peak.
What you’re witnessing right now is the perfect recipe for a fear rally. I briefly mentioned Friday morning that investors pulled a net $9.4 billion out of U.S. stock funds last week. It’s obvious the herd is terrified. Even the sentiment polls have sharply reversed from bullish to downright bearish…

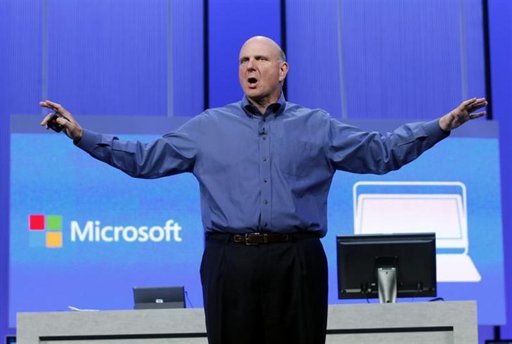 I’ll never forget the sheer physical presence of Steve Ballmer the first time we met. It was a little intimidating to shake the hand of the man who had only recently become Microsoft’s second-ever CEO, and he had a very firm grip. He seemed like the kind of guy who could easily bust a door or break some Windows. Instead, he may be remembered as the guy who broke Windows.
CLICK HERE to see complete article

- An unreliable omen strikes again…
- Taking an honest look at fear
- Plus: Winning with price-driven trading
The stock market is a fiery zeppelin crash waiting to happen.
Well, maybe not. But that’s what the financial media coverage of a rather complicated technical indicator would like you to believe.
Everywhere I look, I’m seeing breathless mentions of something called the Hindenburg Omen. Some sources are reporting as many as 11 Hindenburg Omens have materialized just over the past few weeks.

“A Google News search for the term “Hindenburg Omen” returned 6,340 results this weekend, and more than a few dramatic photos of the ill-fated Zeppelin airship,” writes my trading buddy Jonas Elmerraji. “Yup, fear is the predominant emotion in stock investors right now – why else would click-hungry media outlets push some obscure market indicator named after a gruesome disaster?”
On top of the perfectly-named Hindenburg Omen, we experienced a 2% drop in the broad market last week. So conditions are ripe for some new worries.
But aside from its catchy (and terrifying) name, what’s the deal with the Hindenburg Omen?
For starters, if you’ve bothered to read any of the articles that cite the indicator, you’ve probably noticed that none of them really explain what the hell the Hindenburg Omen measures. That’s because it’s incredibly complicated. Fully grasping the Hindenburg Omen requires more than a rudimentary understanding of simple technical analysis techniques.
I’m not even going to bother wasting my time trying to lay it all out for you. I can’t even come up with a simplified explanation beyond the fact that it’s bearish and it involves tallying NYSE advances plus declines and new highs vs. new lows. And that doesn’t even begin to get into the nuances of what’s required to trigger the indicator…
If the Hindenburg Omen had a mundane name, it never would have caught on. Its track record for calling major tops isn’t consistent (Hindenburg Omens made similar headlines in 2010, for example). Most people don’t even know how it works. It looks good in a bearish market story. But it’s not something anyone should use as a trading signal.
It’s no secret that the short-term trend for stocks is lower. The S&P 500 has dropped five out of the last six trading days. So far, we’ve seen a retreat of 3% this month. But if you’re prepared for a bigger correction, the big, scary headlines won’t ruin what has been a solid year for stocks so far.
Maintain appropriate stop losses and sell when they’re triggered. Don’t force any new trades while the market is falling. And don’t blindly sell out of your positions based solely on fear. Keeping a clear mind during a correction (of any magnitude) will put you eight steps ahead of every other investor on the planet.
In the 1990s, tech stocks were the place to be. After the dot-com bust, those who placed their money in bonds or shorted stocks did very well until October 2002. The winning asset class between late 2002 and October 2007 was stocks. History tells us picking the right asset class buckets is extremely important in the quest for satisfying investment returns.

Limited Capital To Allocate To Buckets
With central banks around the globe skewing the prices of stocks and bonds via artificially low interest rates, it is harder than ever to make allocation decisions.

….much more HERE
Stock Trader’s Almanac has been parsing equity market returns during the various years of the Presidential Cycle for decades; election years, pre- and post-election years, and mid-term years. The goal is to help equity investors to know when to expect highs and lows in the market based on what year of the cycle they happen to be interested in.
….see the chart & commentary HERE

-
I know Mike is a very solid investor and respect his opinions very much. So if he says pay attention to this or that - I will.
~ Dale G.
-
I've started managing my own investments so view Michael's site as a one-stop shop from which to get information and perspectives.
~ Dave E.
-
Michael offers easy reading, honest, common sense information that anyone can use in a practical manner.
~ der_al.
-
A sane voice in a scrambled investment world.
~ Ed R.
Inside Edge Pro Contributors

Greg Weldon

Josef Schachter

Tyler Bollhorn

Ryan Irvine

Paul Beattie

Martin Straith

Patrick Ceresna

Mark Leibovit

James Thorne

Victor Adair