
Stocks & Equities
Now is a time for caution in equity market. Special situations are available as indicated below. A healthy weight in cash and cash equivalents makes sense between now and the end of September.
July Consumer Prices to be released at 8:30 AM EDT on Tuesday are expected to increase 0.1% versus a gain of 0.3% in June.Excluding food and energy, July CPI is expected to increase 0.1% versus a gain of 0.1% in June.
July Housing Starts to be released at 8:30 AM EDT on Tuesday are expected to increase to 964,000 from 893,000 in June.
FOMC Meeting Minutes from the July 30th meeting are expected to be released at 2:00 PM EDT on Wednesday
Initial Weekly Jobless Claims to be released at 8:30 AM EDT on Thursday are expected to fall to 308,000 from 311,000 last week.
July Existing Home Sales to be released at 8:30 AM EDT on Friday are expected to slip to 5.00 million units from 5.04 million units in June.
Canadian June Retail Sales to be released at 8:30 AM EDT on Friday are expected to increase 0.4% versus a gain of 0.7% in May.
Canadian July Consumer Prices are expected to slip 0.1% versus a gain of 0.1% in June.
August Philadelphia Fed to be released at 10:00 AM EDT on Friday is expected to fall to 15.5 from 23.9 in July.
July Leading Economic Indicators to be released at 10:00 AM EDT on Friday are expected to increase 0.7% versus a gain of 0.3% in June.
Summary of Weekly Seasonal/Technical Parameters for Equity Indices/ETFs
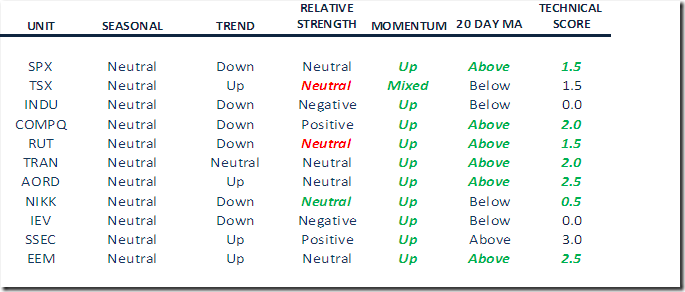
Key:
Seasonal: Positive, Negative or Neutral on a relative basis applying EquityClock.com charts
Trend: Up, Down or Neutral
Strength relative to the S&P 500 Index: Positive, Negative or Neutral
Momentum based on an average of Stochastics, RSI and MACD: Up, Down or Mixed
Twenty Day Moving Average: Above, Below
Green: Upgrade or higher
Red: Downgrade or lower
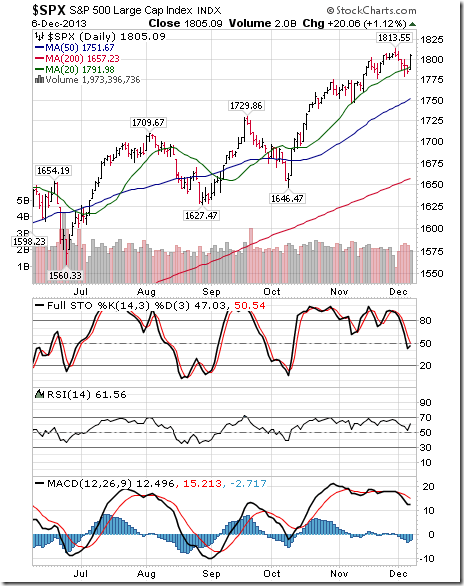
The S&P 500 Index gained 23.47 points (1.22%) last week. Intermediate trend remains down. The Index moved above its 20 day moving average. Short term momentum indicators are trending up. Note that the Index recovered to its breakdown level where resistance was encountered.
…..go HERE and scroll down for Don’s analysis of the TSE & 45 other indices and charts including seasonality

“Only when the tide goes out do you discover who’s been swimming naked.” — Warren Buffett
 Summary
- The Fed liquidity spigot closes in October
- Commercial bank credit growth is picking up the Fed’s slack
- Margin credit and the Yen-carry trade may serve as other monetary spigots
- As long as various monetary spigots remain open, bull market continues on
….continue reading HERE
 In this week’s issue:
- Weekly Commentary
- Strategy of the Week
- Stocks That Meet The Featured Strategy
WEEKLY COMMENTARY
– Stockscores’ Market Minutes Video – Out of Control, Trading the Market Cycle
– Stockscores Trader Training – Doing the Hard Things
– Stock Features of the Week – 2 Long Term ETF Trades
Stockscores Market Minutes Video
You can’t control the market but you can control how you react to it. Work hard only when the market is hot and trade the sectors of the market that are in play. Learn more plus Tyler’s weekly market analysis at
Doing the Hard Things
I believe that making money in the market requires doing what is hard. Often, when your emotions are telling you to take one course of action, you have to go the other way. Here are 10 hard, but necessary, things to do if you want to beat the stock market.
1. Take losses when you are wrong
No one likes to take a loss but losing is part of making money. You have to recognize that the stock market can not be predicted with 100% certainty and accept that being wrong is ok. When the market proves your decision wrong, take the loss!
2. Let profits run when you are right
Never be satisfied with a trade unless it returns you at least twice what you risked on the trade. Of course, more is better; one trade that returns 10 times your risk will pay for 10 losers. Our natural tendency is to fear letting our winners turn in to losers and so we are quick to sell our winners at the first sign of weakness. But realize that is what most people are thinking which means trends will start with a lot of back and forth moves because many investors lack commitment. It is only after a sustained trend upward that the fear diminishes and the trend really starts to accelerate. That is where investors can make the most money, if they stay in the stock long enough to enjoy it.
3. Buy when there is panic selling
The emphasis here is on panic selling, where the overwhelming pessimism has people accepting prices that make no rational sense. Don’t confuse a bear market with panic selling; weakness is not a reason to buy unless it is motivated by panic. Contrarian investing is only effective when emotion causes stocks to be mispriced and that comes with panic selling.
4. Sell when there is irrational buying
When the mass media is espousing the virtues of an investment, when people who know less than nothing about investing are dumping money in to the market, it is probably time to be a seller. If the upward trend goes from being linear to a curve, watch for signs of weakness as the upward trend is nearing its end. At this point, volume will often be much higher than normal and it will seem as though the stock can do nothing wrong.
5. Judge success in groups
Most of us judge our success one trade at a time. Trading is a probability game; you will not make money all of the time so why beat yourself up over a few losses? The only way to judge success is by the amount of money in your account over a large number of trades. Don’t even judge success by how often you are right, it is only about how much money you make over a large number of trades.
6. Test before you trade
To make money in the market, you need a strategy that has an edge. Don’t make investments on a hunch or what someone else tells you to do. Make investments based on a set of rules that you have tested and proven to be successful. Every great trader has a formula, what is yours?
7. Don’t follow the crowd
Average is what most people are doing; do you want to be average? It is only a small percentage of the population that has most of the money and they are making it from the largest group. If you want the money to flow your way, you have to be ahead of the crowd, do things before it is popular.
8. Avoid the headlines
The mainstream media seems to do their big features at or near market tops. If a media outlet has a large audience then their information is going to be priced in by a large number of people. Always remember that it is only a small number of people who beat the stock market which means if you are doing what the large numbers of people are doing, you are probably on the losing side. Going against the headlines will often be the winning strategy.
9. Don’t find comfort in the news
You buy a stock on a tip, based on a trading strategy or maybe after some in depth research. The stock goes down and the market tells you that you made a decision that was wrong. Rather than take the loss, you dig in to the news and find a reason to hang on. Perhaps it is that there are more results coming or that management has a proven track record. Any bit of fundamental information to justify holding the stock when the market tells you not to will help you avoid that negative feeling of taking a loss. Remember, the market never lies and the collective opinion of investors is based on all the information you are looking at. If what you are using to justify the hold is such good information, why are others selling?
10. Keep it simple
Investors have a tendency to get more sophisticated as they lose money. If there set of rules are not working, they add more rules. However, it is not usually the rules that are the problem; it is the application of the rules. People who make money keep it simple but work very hard at being disciplined and unemotional. Easy to say, hard to do.
STRATEGY OF THE WEEK
When looking for a long term position in an Exchange Traded Fund, I look to sectors that have underperformed the overall market in the last year but are showing signs of optimism. Following are two ETFs that fit those criteria as they are coming out of long term downward trends but have Sentiment Stockscores of greater than 60. These ETFs are showing signs that they could play catch up in the next year.
STOCKS THAT MEET THE FEATURED STRATEGY
1. T.XMA
T.XMA has been trending sideways since it broke its downward trend at the start of 2014. The stock built a rising bottom, a sign of optimism, in June and is now trading with low volatility under resistance at $15. I like it if it can make a weekly close above $15.

2. KOL
Coal stocks have not had any respect since 2011 but in the last year they have stabilized and in the last month have started to move higher. The ETF representing this group is KOL. This ETF will encounter some resistance at $20 in the short term but the longer term outlook is good.

References
- Get the Stockscore on any of over 20,000 North American stocks.
- Background on the theories used by Stockscores.
- Strategies that can help you find new opportunities.
- Scan the market using extensive filter criteria.
- Build a portfolio of stocks and view a slide show of their charts.
- See which sectors are leading the market, and their components.
-
Disclaimer
This is not an investment advisory, and should not be used to make investment decisions. Information in Stockscores Perspectives is often opinionated and should be considered for information purposes only. No stock exchange anywhere has approved or disapproved of the information contained herein. There is no express or implied solicitation to buy or sell securities. The writers and editors of Perspectives may have positions in the stocks discussed above and may trade in the stocks mentioned. Don’t consider buying or selling any stock without conducting your own due diligence.

The market decline certainly woke people up over the last week or so. Therefore, this week’s newsletter will focus on the important question: “Is this just a “dip,” or the beginning of a more significant correction?” Also:
….read more by clicking on the chart or HERE

With the help of some of NFTRH‘s standard weekly charts, we take a snapshot of the US stock market.
The Bank index is unbroken from a weekly perspective. People will talk about an H&S but it is not activated until the trend channel and the neckline (a well defined support area) are broken. BKX, along with the Semiconductors has been a notable leader to the entire surprise* phase of the bull market out of Q4, 2012.

A breakdown of support would break this cycle of the bull market (if this is a secular bull market as manyexperts think, then the bull would live again after the cycle completes). It would probably be healthiest to the secular bull case for a breakdown to occur into a relatively small cyclical bear market.
An alternative is that this summer correction proves to be the mini variety, serving to refuel for a final and manic launch to new highs (S&P 500 measurement is after all, 2192) that would ironically put a lie to Team Secular Bull after it ultimately flames out.
* Surprised? Well, I came to be surprised (since moderated) by the longevity and intensity of this bull phase but our analysis was among the distinct minority leaning bullish in Q4 2012 due to the unsustainable hype of the Fiscal Cliff drama and the waning hype of the acute phase of the Euro Crisis. Then in Q1 of 2013 came macro fundamental news (provided for NFTRH subscribers in real time) out of the Semiconductor equipment sector, an up-turned Palladium-Gold ratio and down the road improving ISM, ‘jobs’, etc. Surprised? Nah.
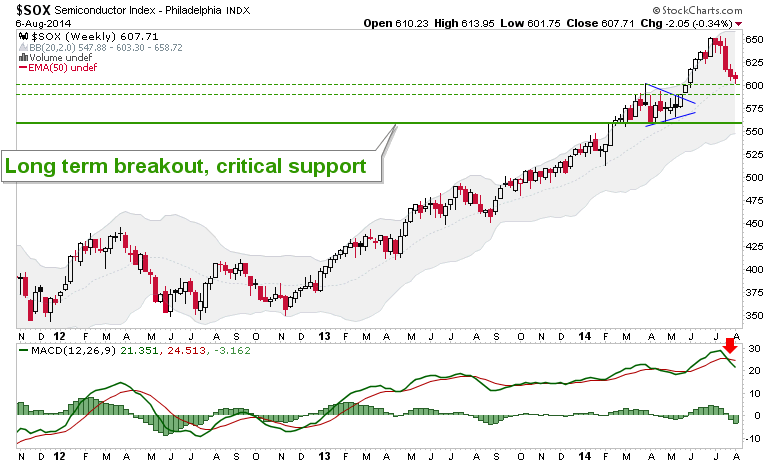
The Semiconductor index has dropped to a logical support area but the important – as in for all the marbles for Team Secular Bull – is the big picture breakout point at 560. It cannot be stressed strongly enough how critical that support would be to determining what this bull market is (or was).
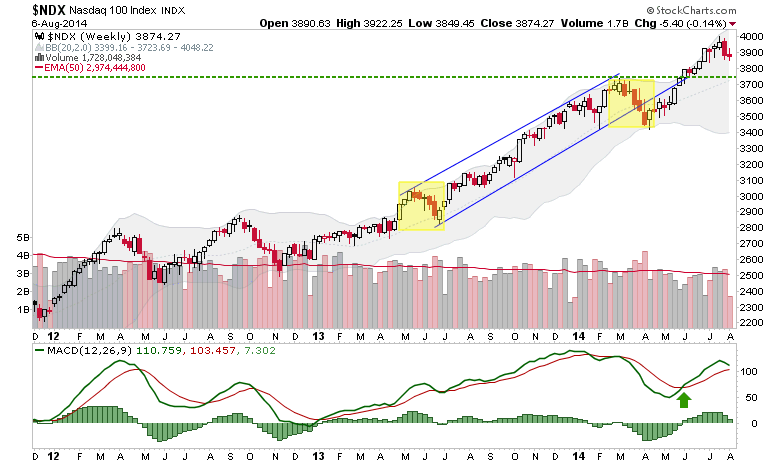
NDX is on a routine drop to test the first support area after yellow shaded correction #2 proved just as bullish as #1.
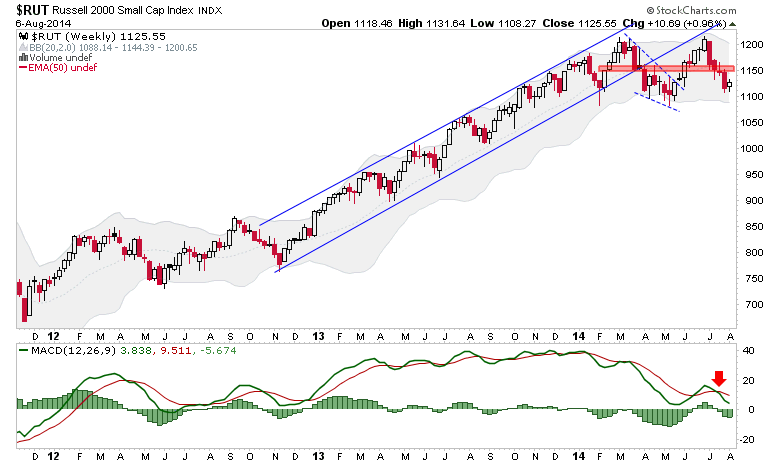
A momentum leader, the Russell 2000 continues to look poor, with an ugly double top forming. As noted previously, a logical point to take bear positioning is at or around 1150.
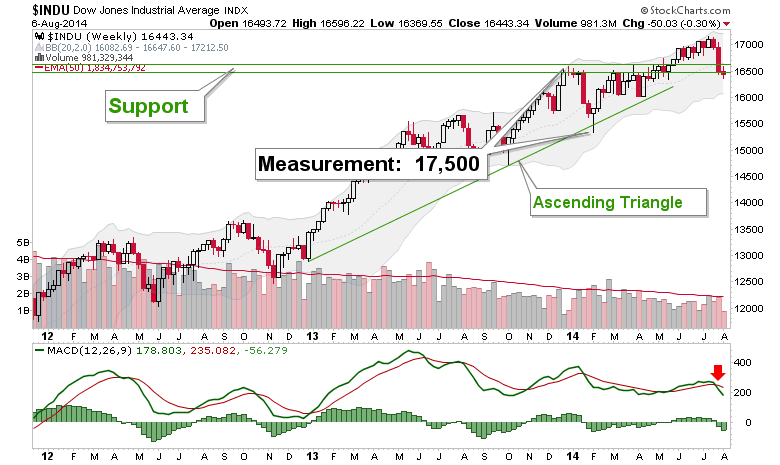
The Dow is getting interesting because it is at support critical to its Ascending Triangle and our long-standing operating target of 17,500. If it breaks down from here it does not mean 17,500 will not be achieved one day, but it does mean that it would not have done it off of this Triangle, which would be neutered before its measurement was achieved.
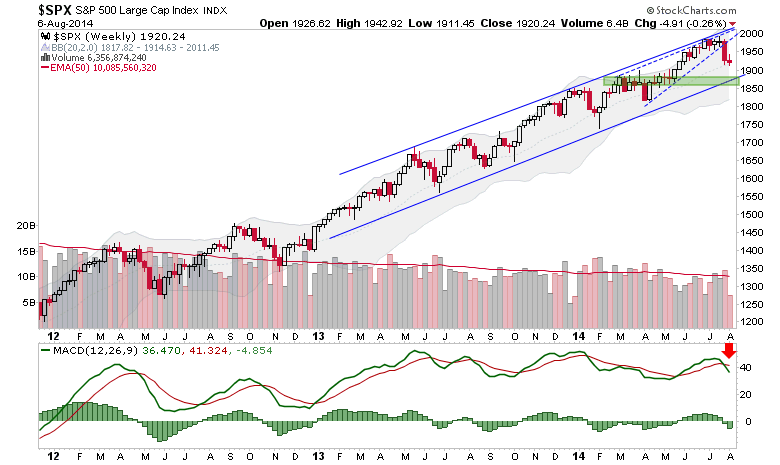
S&P 500′s weekly chart matches up well with the daily we reviewed the other day. While SPX has not (yet) bounced to the degree I had hoped in order to re-short, the important support zones of the daily and the weekly match up nicely. A drop below the noted support would break the bull cycle. But a drop to that zone could prove a buying opportunity. Don’t you love the markets? Parameters parameters everywhere, and not a definitive answer among them.
We’ll wrap it up with a look at the post-Q4 2012 leaders, the BKX-SPX and SOX-SPX ratios.
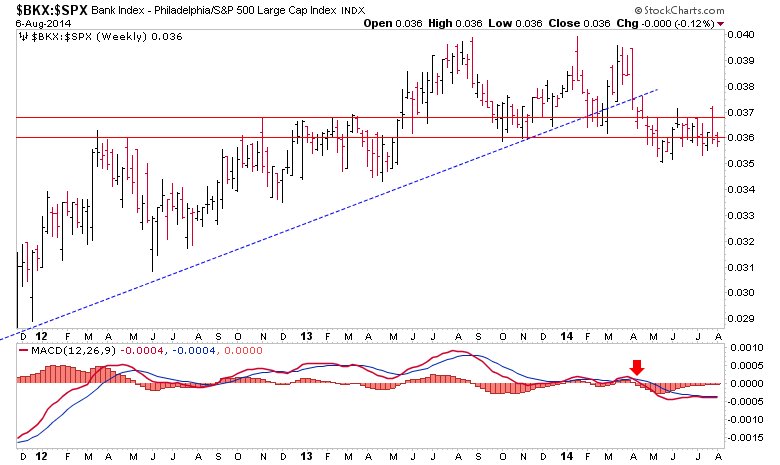
Banks vs. the S&P 500 is still wobbly and below resistance. This ratio led the recent decline in the stock market.
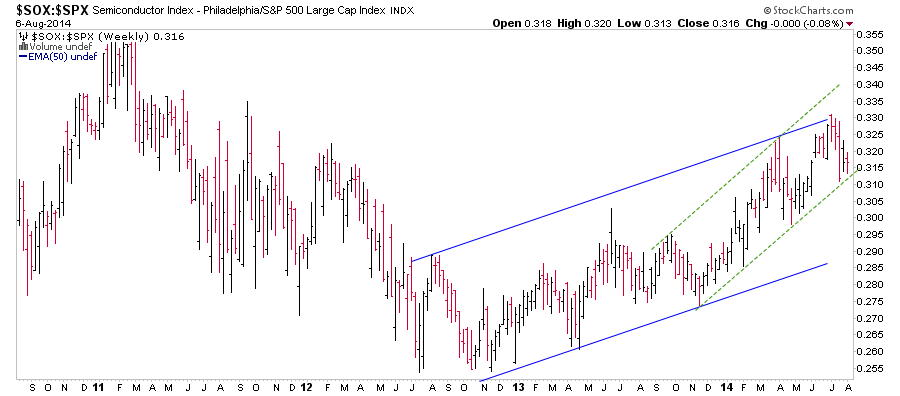
SOX-SPX ratio is well within its post-Q4 2012 channel as well as its more pronounced channel out of 2013. In other words, the Semi’s leadership is a-okay.
Bottom Line
We fully anticipated a summer correction and thus far that is all it has been; and it’s been a mild one (so far) at that. But what the markets do from here on out will refine probabilities as to these options…
Option 1: A shallow correction here, could be a prelude to strongly renewed speculative vigor, culminating in a terminal bull market blow off. Ironically, Team Secular Bull would look heroic for a while and yet, this is not the scenario true secular bull adherents would want to see. A healthy market would need a real bearish clean out and even a moderate cyclical bear.
Option 2: The current correction bites deeper, testing the cyclical bull market’s limits but ultimately holds (using SPX 1860′s as a general reference point).
Option 3: Of course, such a test of limits implies a decision point, and if the decision is that support would fail, then the cyclical bull may have already ended as I write this.
That does not invalidate the prospect that we are in a new secular bull market, but personally I find the ‘secular vs. cyclical’ discussion useless because I for one do not ride cyclical bear markets down in anything resembling a ‘stocks for the long run’ brain wash.
You’ll notice I did not make even a passing mention of policy makers and their influence upon markets. That is because TA is TA and macro fundamental bitching and moaning is what it is. The above is the weekly TA picture on US markets, on the straight and narrow.
Biiwii.com | Notes From the Rabbit Hole | Free eLetter | Twitter
Subscribe to NFTRH Premium for your 25-35 page weekly report, interim updates (including Key ETF charts) and NFTRH+ chart/trade ideas!

-
I know Mike is a very solid investor and respect his opinions very much. So if he says pay attention to this or that - I will.
~ Dale G.
-
I've started managing my own investments so view Michael's site as a one-stop shop from which to get information and perspectives.
~ Dave E.
-
Michael offers easy reading, honest, common sense information that anyone can use in a practical manner.
~ der_al.
-
A sane voice in a scrambled investment world.
~ Ed R.
Inside Edge Pro Contributors

Greg Weldon

Josef Schachter

Tyler Bollhorn

Ryan Irvine

Paul Beattie

Martin Straith

Patrick Ceresna

Mark Leibovit

James Thorne

Victor Adair