Personal Finance
 Here in San Antonio, grocery stores were packed with families stocking up on water and canned food in preparation for Hurricane Harvey, which has devastated Houston and coastal Texas towns. I hope everyone who lives in its path took the necessary precautions to stay safe and dry—this storm was definitely one to tell your grandkids about one day.
Similarly, I hope investors took steps to prepare for some potentially disruptive economic storms, including this past weekend’s central bank symposium in Jackson Hole, Wyoming, and the possibility of a contentious battle in Congress next month over the budget and debt ceiling.
As you’re probably aware, central bankers from all over the globe visited Jackson Hole this past weekend to discuss monetary policy, specifically the Federal Reserve’s unwinding of its $4.5 trillion balance sheet and the European Central Bank’s (ECB) ongoing quantitative easing (QE) program. Janet Yellen gave what might be her last speech as head of the Federal Reserve.
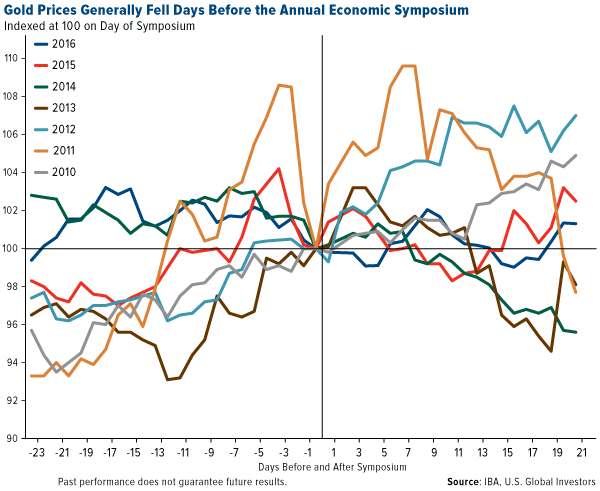
As I told Daniela Cambone on last week’s Gold Game Film, there are some gold conspiracy theorists out there who believe the yellow metal gets knocked down every year before the annual summit so the government can look good. I wouldn’t exactly put money on that trade, but you can see there’s some evidence to support the claim. In most years going back to 2010, the metal did fall in the days leading up to the summit. Gold prices fell most sharply around this time in 2011 before rocketing back up to its all-time high of more than $1,900 an ounce.
Many of the economic and political conditions that helped gold reach that level in 2011 are in effect today. That year, a similar Congressional skirmish over the debt ceiling led to Standard & Poor’s decision to lower the U.S. credit rating, from AAA to AA+, which in turn battered the dollar. The dollar’s recent weakness is similarly supporting gold prices.
In August 2011, the real, inflation-adjusted 10-year Treasury was yielding negative 0.59 percent on average, pushing investors out of government bonds and into gold. Because of low inflation, we might not be seeing negative 10-year yields right now, but the five-year is borderline while the two-year is definitely underwater. Bank of America Merrill Lynch sees gold surging to $1,400 an ounce by early next year on lower long-term U.S. interest rates.
Are Government Inflation Numbers More “Fake News”?
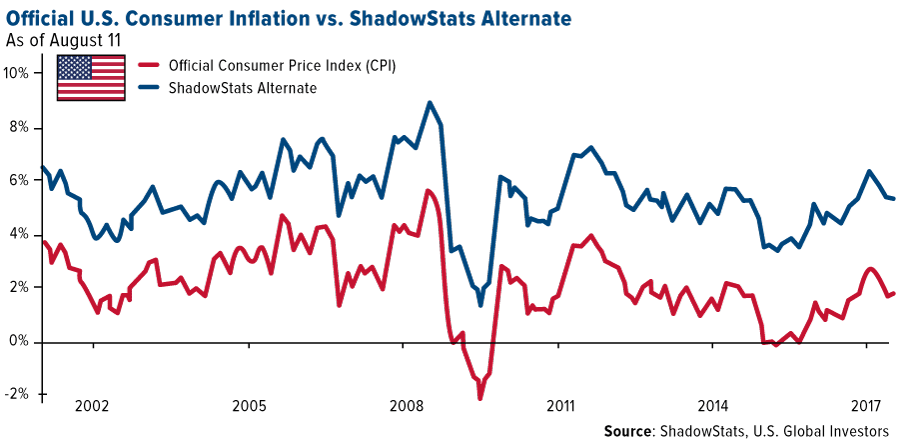
If we use another inflation measure, though, yields of all durations look very negative. For years, ShadowStats has published alternate consumer price index (CPI) figures using the methodology that was used in 1980. According to economist John Williams, an expert in government economic reporting, “methodological shifts in government reporting have depressed reported inflation” over the years. The implication is that inflation might actually be running much higher than we realize, as you can see in the chart below.
If you believe the alternate CPI numbers, it makes good sense to have exposure to gold.
Recently I shared with you that Ray Dalio—manager of Bridgewater, the world’s largest hedge fund with $150 billion in assets—was one among several big-name investors who have added to their gold weighting in recent days on heightened political risk. That includes Congress’ possible failure to raise the debt ceiling and, consequently, a government shutdown. Dalio recommends as much as a 10 percent weighting in the yellow metal, which is in line with my own recommendation of 10 percent, with 5 percent in physical gold and 5 percent in gold stocks, mutual funds and ETFs.
Falling Dollar Good for U.S. Trade
Returning to the dollar for a moment, respected CLSA equity strategist Christopher Wood writes in this week’s edition of GREED & fear that it’s “hard to believe that the political news flow in Washington has not been a factor in U.S. dollar weakness this year.”
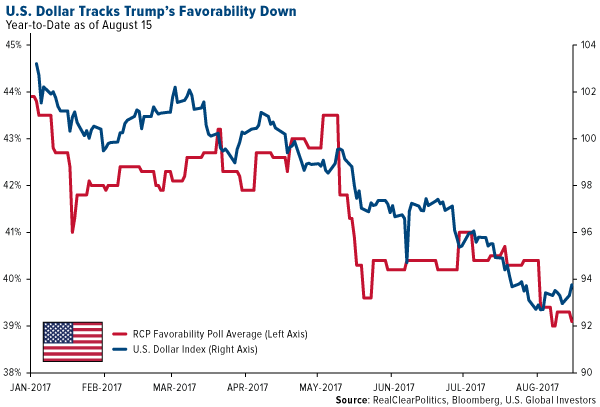
The U.S. media certainly wants you to believe that Trump is bad for the dollar. Take a look at this chart, showing the dollar’s steady decline alongside President Donald Trump’s deteriorating favorability rating, according to a RealClearPolitics poll.
However, a weak dollar is good for America’s economy. I’ve commented before that Trump likes a falling dollar, because it is good for the country’s export trade of quality industrial products. It’s also good for commodities, which we see in a rising gold price and usually energy prices.
Ready for a Big Fight?
You might have watched the Mayweather vs. McGregor fight, but have you been watching the fight between Trump and the Fed?
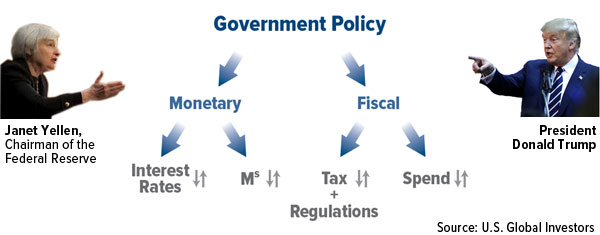
At the symposium in Jackson Hole, Fed Chair Janet Yellen squared up directly against Trump when she defended the strict regulations that were put in place after the financial crisis. Echoing these comments was Dallas Fed chief Robert Kaplan. This is the opposite of what Trump has been calling for, which is the streamlining of regulations that threaten to strangle the formation of capital.
It’s important to recognize that the market is all about supply and demand. The number of public companies in the U.S. has been shrinking, with about half of the number of listed companies from 1996 to 2016. Readers have seen me comment on this previously, and I believe that the key reason for this shrinkage is the surge in federal regulations. The increasingly curious thing is that we are seeing the evolution of more indices than stocks, as the formation of capital must morph.
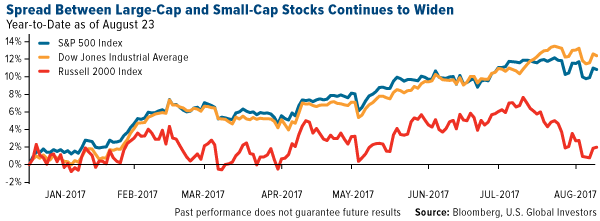
As I told CNBC Asia’s Martin Soong this week, there is a huge amount of money supply out there, and investors are looking for somewhere to invest. The smaller pool of stocks combined with the greater supply of money means that the market has seen all-time highs. In addition, major averages were regularly hitting all-time highs not necessarily on hopes that tax reform would get passed, but on strong corporate earnings, promising global economic growth and the weaker U.S. dollar.
Meanwhile, small-cap stocks are effectively flat for 2017 and heading for their worst year since 1998 relative to the market, according to Bloomberg. Hedge funds’ net short positions on the Russell 2000 Index have reached levels unseen since 2009. Remember, these are the firms that were expected to be among the biggest beneficiaries of Trump’s “America first” policies.
However, the weakness in U.S. manufacturing has a great impact on the growth of these stocks, as indicated by the falling purchasing managers’ index (PMI). The slowdown in manufacturing is offset by strength in services, shown by the Flash composite PMI score of 56.0 which came out this week. Though there is a spread between large-cap and small-cap stocks, historically this strong score is an indicator of growth to come.
Some big-name investors and hedge fund managers are turning cautious on domestic equities in general. On Monday, Ray Dalio announced on LinkedIn that he was reducing his risk in U.S. markets because he’s “concerned about growing internal and external conflict leading to impaired government efficiency (e.g. inabilities to pass legislation and set policies).” Pershing Square’s Bill Ackman and Pimco’s Dan Ivascyn have also recently bought protection against market unrest, according to the Financial Times. Chris Wood is overweight Asia and emerging markets.
Stay Hopeful
It’s important to keep in mind that there will always be disruptions in the market, and adjustments to your portfolio will sometimes need to be made. For those of you who read my interview with the Oxford Club’s Alex Green, you might recall his “Gone Fishin’” portfolio, which I think is an excellent model to use—and it’s beaten the market for 16 years straight. Green’s portfolio calls for not just domestic equities, Treasuries and bonds but also 30 percent in foreign stocks and as much as 10 percent in real estate and gold.
Stay safe out there! In the meantime, explore investment opportunities in emerging markets!
All opinions expressed and data provided are subject to change without notice. Some of these opinions may not be appropriate to every investor. By clicking the link(s) above, you will be directed to a third-party website(s). U.S. Global Investors does not endorse all information supplied by this/these website(s) and is not responsible for its/their content.
The S&P 500 Stock Index is a widely recognized capitalization-weighted index of 500 common stock prices in U.S. companies. The Russell 2000 Index is a U.S. equity index measuring the performance of the 2,000 smallest companies in the Russell 3000. The Russell 3000 Index consists of the 3,000 largest U.S. companies as determined by total market capitalization. The Dow Jones Industrial Average is a price-weighted average of 30 blue chip stocks that are generally leaders in their industry.
The Consumer Price Index (CPI) is one of the most widely recognized price measures for tracking the price of a market basket of goods and services purchased by individuals. The weights of components are based on consumer spending patterns.
The Purchasing Manager’s Index is an indicator of the economic health of the manufacturing sector. The PMI index is based on five major indicators: new orders, inventory levels, production, supplier deliveries and the employment environment.
The U.S. Dollar Index is an index (or measure) of the value of the United States dollar relative to a basket of foreign currencies, often referred to as a basket of U.S. trade partners’ currencies.

In this week’s issue:
- Weekly Commentary
- Strategy of the Week
- Stocks That Meet The Featured Strategy

In This Week’s Issue:
– New Stockscores website coming soon
– Stockscores at the Toronto Money Show
– Stockscores’ Market Minutes Video – Avoiding Fear and Recklessness
– Stockscores Trader Training – Fear or Fact, What Drives Your Trades?
– Stock Features of the Week – Abnormal Breaks US
–
New Stockscores website coming soon
The new Stockscores website will be launching soon. Once it is live, you will no longer be able to subscribe to use the Stockscores Market Scan unless you have completed one of our courses. If you are subscribed before we make the switch, you will be grandfathered until you cancel your subscription.
Stockscores at the Toronto Money Show
I will be doing two presentations at the Toronto Money Show in September, one free and the other a Master Class that you can purchase a discounted ticket to until August 17th. For more information on these two presentations, click here.
Stockscores Market Minutes – Avoiding Fear and Recklessness
Traders must avoid fear and recklessness to be profitable. This week, I discuss this, my weekly market analysis and the trade of the week on LC. Click Here to Watch
To get instant updates when I upload a new video, subscribe to the Stockscores YouTube Channel
Trader Training – Fear or Fact, What Drives Your Trades?
Speaking from experience, I have found that most mistakes in trading are the result of succumbing to fear. When I say mistakes, I don’t mean losses since losing money on trades is part of trading. Instead, I mean those bad trades that we all take which don’t fit in to our trading strategy and plan.
The fear based decisions that cause us to deviate from our trading rules can be broken down in to two types.
First, the trading decisions that we make because of our fear of losing money. These are usually exit trades; we sell too early for fear that our winner will turn in to a loser. Perhaps we fail to take a trade that fits our criteria because our “common sense” tells us there is something wrong with the trade and that it can’t succeed. Maybe we enter a trade later than we should because we want to see the market prove our trading idea correct, only to end up getting in once much of the run has happened.
The second fear based trading mistakes we make are those that are the result of our fear of missing out. These tend to be on the entry; we take trades that don’t quite fit our rules because we focus on what might be, the profits that could happen. It may be that we listen to an “expert” in the media or follow the actions of the crowd and do what the headlines are telling us to do.
Have you ever succumbed to either of these fear based trading mistakes?
If you are a normal human being, I think it is highly unlikely that you have not. Since they happen to all of us, we need to figure out a solution. Fortunately, the solution is quite simple.
Rather than focus on fear, focus on fact. Make trades based on what is happening, not what you think could happen.
Many have described fear as “future events appearing real”. We don’t walk down a dark alley at night because we might get mugged. We don’t swim in the ocean because we might get attacked by a shark. We don’t fly on a plane because it might crash.
When we focus on what might happen, what our fear tells us to do, we typically ignore probability. The probability of getting attacked by a shark is extremely low. Last year, you actually had a greater chance of dying taking a selfie photograph than by being attacked by a shark. If we focus on fact, we get better results.
This does not mean you should ignore fear. It is there to protect us and, when probability is on the side of the decision, it is best to listen to fear. I stopped flying small airplanes because the statistics showed that it was a dangerous thing to do. I still trade stocks because I have strategies that put the statistics in my favor.
When you trade, take your focus off of your emotion and look at the facts. Develop a trading strategy that puts probability for profit in your favor. Have a process in place to assess the facts and take the trades that meet your requirements. Overcome fear in favor of fact.
This week, I looked at the Abnormal Gainers US on Monday and checked the charts for breaks of downward trend lines after a rising bottom had formed. This is a good turnaround indicator, here are a few charts that stand out:
1. PNK
PNK tried to break its pull back last week but failed, it made the break today on good volume. Support at $18.93

2. QRVO
QRVO breaks up from a rising bottom with average volume. Support at $64.70.

3. INTU
INTU has been quiet for the past two months but broke higher from a rising bottom today. Support at $134.80

References
- Get the Stockscore on any of over 20,000 North American stocks.
- Background on the theories used by Stockscores.
- Strategies that can help you find new opportunities.
- Scan the market using extensive filter criteria.
- Build a portfolio of stocks and view a slide show of their charts.
- See which sectors are leading the market, and their components.
Disclaimer
This is not an investment advisory, and should not be used to make investment decisions. Information in Stockscores Perspectives is often opinionated and should be considered for information purposes only. No stock exchange anywhere has approved or disapproved of the information contained herein. There is no express or implied solicitation to buy or sell securities. The writers and editors of Perspectives may have positions in the stocks discussed above and may trade in the stocks mentioned. Don’t consider buying or selling any stock without conducting your own due diligence.
Earlier today, I had the pleasure of discussing gold, equity valuations, bond bubbles, and inflation with Greg Hunter at USA Watchdog.
In the interview, I mentioned the nearly “everything bubble” and stated a belief that gold was one thing that was not in a bubble.
Following the interview, Hunter asked me to put my thoughts on gold and the “nearly” everything bubble in writing. Specifically, Hunter asked: “How Much Gold Should the Common Man Own?”
My answer follows. First, please consider my USA Watchdog interview: The Everything Bubble – Mike “Mish” Shedlock
How Much Gold?
There is no one correct percentage, but this rule applies: If you have trouble sleeping at night or are constantly worried about the price, then you likely have too much. If you are worried about a price drop of a few hundred dollars, or the equivalent percent in stock or bonds, you probably should not be investing in anything.
It’s curious that people are worried about gold but not the obvious bubbles that surround them. Media contributes to the ignorance by demonizing gold while praising bubbles.
It should be clear to any rational thinker that the Fed (central banks in general) blew amazing asset bubbles in equities and junk bonds in their response to the “Great Recession”. In their misguided quest to produce inflation, which they do not even know how to measure, central banks even re-blew the housing bubble.
In general, 10% to 25% in physical gold and silver seems like a reasonable amount. At major lows, miners offer tremendous opportunities. They were practically giving away miners in late 2015 and early 2016.
Outside of precious metals and miners, good investment opportunities are scarce. High cash allocations are likely to be wise. To be fair, I have been saying this for several years. This only proves that bubbles can always get bigger, until they don’t.
By Mike Shedlock
 The Work and pensions secretary David Gauke have revealed that parliament proposes to raise the pension age to 68. The pension crisis that is brewing throughout Western culture reflects the insanity of lowering interest rates to try to “stimulate” the economy. This policy has set the stage for the next great crisis brewing, which will expose the postwar Socialism is just a total failure.
The rise in government on average to about 40% of GDP means that this is consuming the wealth of every nation and suppressing the economic growth. This is forcing people to work longer to survive and hence they do not retire quickly into the sunset holding on to jobs that then in turn cause higher unemployment in the next two generations. There is not much we can do about this because politicians will never act to prevent a crisis, they perfect to act only when a crisis emerges. Consequently, the Pension Crisis is simply unavoidable.
…also from Martin:
 Three months ago (April) we covered the reasons we primarily invest in junior exploration companies. We promised to follow up with some criteria we follow in attempting to pick winners. Here are five things we look for when evaluating and selecting junior exploration companies.
Management has a track record and experience.
There is a decent number of executives in the junior industry that were part of or led a company to an acquisition. If they have done it before then they know what needs to be done in order to do it again. If management has not been involved in a transaction, check to see if they have discovered a deposit or expanded a resource through drilling. Also, seek out the executives that had ample experience at a major company.
Do not stop with the CEO. Also consider the track record and experience of the chief geologist. They are just as important.
Strong capital structure and a small retail float
The capital structure refers to the cash, shares outstanding and warrants and options. We are looking for companies with cash, tight share structures and tight floats. That means enough cash to move forward (without needing to raise multiple times) a low number of warrants and options and a small retail float.
The float is the number of shares available for trading after subtracting closely held shares. The smaller the retail float, the more amount of stock is tightly held (by insiders, institutions and large investors). Stocks with tighter retail floats can rise more quickly than stocks with larger retail floats. It’s basic supply and demand and the size of the retail float is just as important as the overall structure itself.
Industry sponsorship
Juniors can have industry sponsorship through joint ventures or investment. Has a major gold mining company invested in the junior or partnered with the junior on its project? That would certainly lend quite a bit of credibility to the junior and its project.
Note that this is only one criteria and not a declaration to follow every major company into every investment they make. They can get better terms than you and I and they make mistakes too.
The company has a deposit or could find a deposit a major would want
To be specific that means a project with multi million ounce potential and grade. We are looking for 2M-3M oz Au potential with 100K oz Au/yr production potential at a minimum. To be more specific, we want high margin potential projects. Something with marginal grade could be high margin and something with very good grade could only be marginal. Size and grade are a good starting point for high margin potential but one size does not fit all. Speaking of size, look for projects that have district-scale potential. In other words, look for very large land packages that could host more than one deposit.
Exploration companies are obviously further down on the food chain and not concerned with economic studies. However, in general we want projects that could have an internal rate of return of 15%-20% per year at $1100 to $1200 Gold.
Look for value and growth potential
Price is what you pay and value is what you get. You are either a contrarian or a victim. These are obviously quotes from investors much smarter than me. Buying high and selling higher can work in the conventional markets but it rarely works with respect to exploration companies. That could be because of the cyclicality of the industry as well as the much publicized “life cycle” that junior companies go through.
Valuing exploration companies is subjective and can be quite difficult. In short, we want to buy value but also growth potential. In other words, look for projects or deposits that have exploration upside. Companies can add value this way even if metals prices do not rise. The ideal situation is a junior that is undervalued but could grow its deposit materially.
Even though metals prices are down over the past 12 months, they are not preventing companies from being rewarded by adding value to their deposits or discovering new deposits. This reflects the turn in the industry cycle in late 2015 and that will not change even if metals prices retest their lows. We have a bearish outlook for the next six to nine months and if Gold breaks below $1200 it could create some very compelling values in the junior exploration sector.
Jordan Ro-Byrne

