
Timing & trends
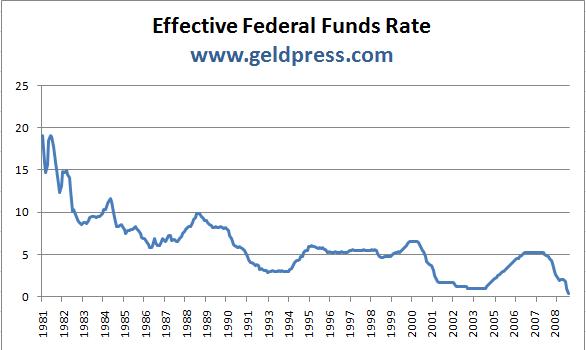
Click Chart for Larger Version: While it is difficult to properly attribute blame for the collapse of the US economy, which commenced in the early 1980s, on either the Fed’s policy of easy money starting with Alan Greenspan (and terminating with today’s statement by Goldman that merely a suggestion of “not easing” may be equivalent to “tightening” – a symptom of a terminal junkie), or the resultant self-indulgent lifestyle of the maturing baby boomers, one thing is certain: the paradigm downturn of the United States began in the early 1980s.


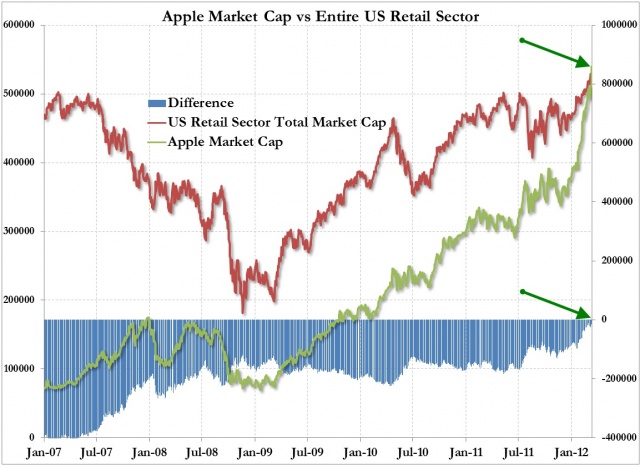
File this one under the “check back in 10 years” folder. This is a stat that will blow your mind. Apple’s market cap is now bigger than the ENTIRE U.S. retail sector. Now, I wouldn’t short AAPL in a million years, but these are the sorts of crazy stats that make you think “hmmm, is this really sustainable?”
As ZeroHedge says: “A company whose value is dependent on the continued success of two key products, now has a larger market capitalization (at $542 billion), than the entire US retail sector (as defined by the S&P 500). Little to add here”.

The Federal Reserve ran another “stress test” on major financial institutions and has determined that 15 of the 19 tested are safe, even in the most extreme circumstances: an unemployment rate of 13%, a 50% decline in stock prices, and a further 21% decline in housing prices. The problem is that the most important factor that will determine these banks’ long-term viability was purposefully overlooked – interest rates.
In the wake of the Credit Crunch, the Fed solved the problem of resetting adjustable-rate mortgages by essentially putting the entire country on an teaser rate. Just like those homeowners who really couldn’t afford their houses, our balance sheet looks fineunless you factor in higher rates. The recent stress tests assume market interest rates stay low, the federal funds rate remains near-zero, and 10-year Treasuries keep below 2%. Why are those safe assumptions? Historic rates have averaged around 6%, a level that would cause every major US bank to fail!
The truth is that higher rates are the biggest threat to the banking system and the Fed knows it. These institutions remain leveraged to the hilt and dependent upon short-term financing to stay afloat. While American families have had to stop paying off one credit card by moving the balance to another one, this behavior continues on Wall Street.
In fact, this gets to the heart of why the Fed is keeping interest rates so low. Despite endorsing phony economic data that shows the US is in recovery, the Fed knows full well that the American economy cannot move forward without its low interest-rate crutches. Ben Bernanke is trying desperately to pretend that he can keep rates low forever, which is why that variable was deliberately left out of the stress tests.
Unfortunately, rates are kept low with money-printing, and those funds are starting to bubble over into consumer prices. Bernanke acknowledged that the price of oil is rising, but said without justification the he expects the price to subside. This shows that Bernanke either doesn’t know or doesn’t care that the real culprit behind rising oil prices is inflation. McDonald’s, meanwhile, is eliminating items from its increasingly unprofitable Dollar Menu. A dollar apparently can’t even buy you a small order of fries anymore.
Unless the Fed expects us to live with steadily increasing prices for basic goods and services, it will eventually be forced to allow interest rates to rise. However, if it does so, it will quickly bankrupt the US Treasury, the banking system, and any Americans left with flexible-rate debt.
That is why the Fed feels it has no choice but to lie about inflation. If it admits inflation exists, then it may be pressured to stop it. However, if it stops the presses, it will bring on the real crash that I have been warning about for the past decade. Just as the Fed’s response to the 2001 crisis led directly to the 2008 crisis, its response to 2008 is leading inevitably to either deep austerity or a currency crisis.
[For more on the crisis ahead, pre-order Peter Schiff’s latest book, The Real Crash, due out in May.]
Imagine this scenario:
When the banks fail as a result of higher interest rates, the FDIC will also go bankrupt. Without access to credit, the US Treasury will not be able to bail out the insurance fund – which only contains $9.2 billion as of this writing. So, not only will shareholders and bondholders lose their money next time, but so too will depositors!
Americans are much less self-sufficient than they were in the Great Depression. One only needs to look at Greece to see how a service-based economy deals with this kind of economic collapse – crime, riots, vandalism, and strikes.
There are a few countermeasures left in the government’s arsenal, including selling the nation’s gold, but there comes a point at which the charade can go on no longer. The sharply widening current account deficit shows that we are becoming even more dependent on imports that we cannot afford. Just as homeowners had a good run pulling equity from their overvalued properties, Washington and Wall Street will soon find the music turned off. And there will be no one there to help them clean up the mess left behind.
I propose a new rule of thumb: until true economic growth resumes in the distant future, the fed funds rate should also be used as the “Federal Reserve credibility rate.” We’ll use a scale of 0-20, which is approximately how high rates went under Paul Volcker to restore confidence in the dollar. So, until the end of this crisis, if the fed funds rate is near-zero, all the Fed’s statements, forecasts, and stress tests should be given near-zero credibility. When rates rise to 5%, the Fed’s words can be assumed to be ¼ credible. When they hit 20%, that would be a Fed whose words you could take to the bank – if you can still find one.
For in-depth analysis of this and other investment topics, subscribe to Peter Schiff’s Global Investor newsletter. CLICK HERE for your free subscription.
For a great primer on economics, be sure to pick up a copy of Peter Schiff’s hit economic parable, How an Economy Grows and Why It Crashes.
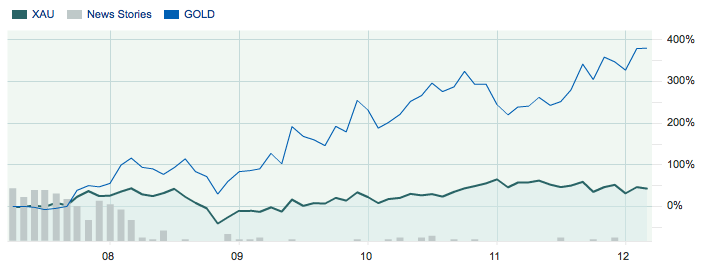
Get ready for a golden summer.
Precious metals have been selling off lately. Gold is down 10% from its peak last August, including a violent $100 drop last Tuesday. Silver is down almost 30% since its peak last April. It dropped 6% in just one day last week.

A Juxtaposition:

-
I know Mike is a very solid investor and respect his opinions very much. So if he says pay attention to this or that - I will.
~ Dale G.
-
I've started managing my own investments so view Michael's site as a one-stop shop from which to get information and perspectives.
~ Dave E.
-
Michael offers easy reading, honest, common sense information that anyone can use in a practical manner.
~ der_al.
-
A sane voice in a scrambled investment world.
~ Ed R.
Inside Edge Pro Contributors

Greg Weldon

Josef Schachter

Tyler Bollhorn

Ryan Irvine

Paul Beattie

Martin Straith

Patrick Ceresna

Mark Leibovit

James Thorne

Victor Adair