
Bonds & Interest Rates
The Hera Research Newsletter is pleased to present a fascinating interview with Martin A. Armstrong, founder and former Head of Princeton Economics, Ltd. In the 1980s, Princeton Economics became the leading multinational corporate advisor with offices in Paris, London, Tokyo, Hong Kong and Sydney and in 1983 Armstrong was named by the Wall Street Journal as the highest paid advisor in the world.
As a top currency analyst and frequent contributor to academic journals, Armstrong’s views on financial markets remain in high demand. Armstrong was requested by the Presidential Task Force (Brady Commission) investigating the 1987 U.S. stock market crash and, in 1997, Armstrong was invited to advise the People’s Bank of China during the Asian Currency Crisis.
Based on a study of historical gold prices and financial panics, Armstrong developed a cyclical theory of commodity prices, which lead to the pi-cycle economic confidence model (ECM), used to make long term forecasts. Using the ECM, Armstrong predicted both the high-water mark of the Nikkei in 1989, months ahead of time, and the July 20, 1998 high in the U.S. equities market, as well as a major top in financial markets on February 27, 2007. The ECM was called “The Secret Cycle” by the New Yorker Magazine and Justin Fox wrote in Time Magazine that Armstrong’s model “made several eerily on-the-mark calls using a formula based on the mathematical constant pi.” (Pg 30; Nov. 30, 2009).
…..read the whole interview HERE (scroll down a bit)

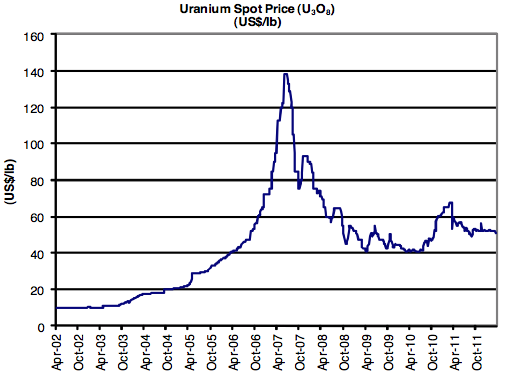
Resource Capital Research covers 9 exploration, development and production companies in this report. It is over 12 months since the Fukashima accident & the impact has been factored in. The market is expected to be broadly
The Key Points:
“The crucial question over the next decade is not “where will my returns be highest?” but “where will I lose the least money?. The inevitable crash, or “rebooting the computer,” will simply have to be endured. He advises how investors should play this situation:
Equity-like corporate bonds – 25% of a portfolio. Another 25% made up of stocks, especially in emerging markets, with a further 25% in precious metals (which tend to be severely underweighted in a typical pension fund). Real estate in certain areas (such as Asia) for the remainder. He added that US house prices are looking decidedly cheap and that an investment in remote farmland could pay off, as growing social tensions could make urban life intolerable.
Marc Faber: Continuing Financial Crisis Must Be Endured – (The Entire Article)
Marc Faber, editor of “The Gloom, Boom and Doom Report,” kicked off the CFA Institute Middle East Investment Conference by quoting Ernest Hemingway who said, “The first panacea for a mismanaged nation is inflation of the currency; the second is war. Both bring a temporary prosperity; both bring permanent ruin.” On this downcast note, Faber attacked short-term Keynesian spending and reviewed the implications for investors of the accelerating shift of world economic and political power from the developed countries to the developing world.
Central bank action to cut interest rates, whilst intended to boost consumption and hence economic growth, has had unintended and severely negative consequences. Faber argued that “dollar bills dumped by helicopters” all over the US have not been channelled into housing, as hoped, but into other more speculative asset classes, particularly commodities such as precious metals and oil. He added that expansionist monetary policies have contributed to higher financial and economic volatility, in addition to inflation. Since greater money supply does not flow evenly across sectors, this gives rise to asset bubbles, which are not easy to identify.
For Faber, at the start of any bubble, “promoters have the vision, and investors have the money.” But the reverse occurs as the bubble bursts: the promoters end up with the money, while most people lose out. Current negative real interest rates, which make cash a safe, but poorly-returning investment, penalize savers, and encourage them to speculate. But Faber asked, “Is deflation such a bad thing?” During deflationary periods in the nineteenth century, real per capita income apparently increased faster than it does now.
Faber also noted that excessive debt always contributes to risk. For example highly leveraged US developers became insolvent when the housing bubble burst, in contrast to their more conservative Hong Kong counterparts who managed to remain solvent. Borrowing has increased just to maintain a standard of living. In 1980, US debt/GDP stood at 140%. Now it is approaching 400%, if unfunded liabilities such as social security and Medicare are taken into account. As a result, adjusted US government debt now exceeds $15 trillion, and continues to rise. US spending is up, but taxes are down. Faber contended that the vast majority of tax revenue goes to mandatory expenditures such as medical care, social security and interest expense rather than to capital formation. Given these imbalances Faber is unsurprised that the quality of US government bonds has been called into question.
By slashing interest rates, governments have also contributed to higher commodity prices, especially oil prices, according to Faber. Any intended boost to consumption is undone by higher energy prices which act as an additional tax on the consumer.
Adding that the G7’s exports continue to decline, Faber contrasted this with climbing developing world exports, resulting in rapidly growing reserves among emerging economies. These reserves will be spent on scarce resources such as precious metals and other commodities. Faber believes that oil demand among the emerging economies now exceeds that of the developed world. China is increasingly absorbing the world’s resources to feed its growth. It is positioning itself carefully as a global economic and political power, assiduously dominating shipping lanes, forging alliances with neighboring states, and investing heavily, so much so that Faber argues China has now got its own domestic credit bubble. Faber sees parallel scenarios being played out in India, Southeast Asia and Latin America. The growing economic power of these nations will inevitably lead to further geopolitical tensions where the MENA region is a potential powder keg.
So how should investors play this situation? Faber states that diversification is key alongside low leverage. His recommendations are as follows: cash and bonds are not hugely attractive, given negative real interest rates, but equity-like corporate bonds could form 25% of a portfolio. Another 25% could be made up of stocks, especially in emerging markets, with a further 25% in precious metals (which tend to be severely underweighted in a typical pension fund). Real estate in certain areas (such as Asia) could make up the remainder. He added that US house prices are looking decidedly cheap.
Faber closed his speech by emphasizing that the crucial question over the next decade is not “where will my returns be highest?” but “where will I lose the least money?” In fact, he believes that losses of 50% should be considered as a relative success. He advised that an investment in remote farmland could pay off, as growing social tensions could make urban life intolerable. In his view the welfare state has evolved from the many helping the few to the few helping the many and that the inevitable crash, or “rebooting the computer,” will simply have to be endured. Whether this crisis occurs soon, as further credit expansion is voluntarily abandoned, or occurs later, as the currency system meets final and total catastrophe, Faber cannot predict.
These four charts below are just the sort of Big Picture, long cycle perspective that so many investors overlook or simply have no knowledge about. These charts are not about making predictions, but rather, are about putting market action into some broader historical context. What has happened in the past? What is typical? Aberrational?

Due to an overwhelming number of inquiries over the past few days I am sending out this brief market update, which I know is a few weeks overdue for sure.
The Spring market for purchase and sale has been extremely busy, as has the refinance side of things, as such finding the time to put something detailed together has been a challenge. My apologies.
Every Spring for the past three years we seem to have the same situation, it is starting to feel like that Bill Murray Movie ‘Groundhog Day’.
A few Big Banks get their economists on the news telling folks that rates are moving up and they had better lock in, get out of the ‘risky’ (non-profitable) variable and into a nice ‘safe’ (profitable) fixed rate product.
Then each year we see rates trickle back down to the same or lower levels as they were at before. Lately all of the media attention has been on a 4 year fixed rate product that has in fact been around for months, and on a very limited ‘no-frills’ 5 year special – which ironically enough was available in November 2011 through the broker channel but received no fanfare.
This Spring feels no different than the last three because bond markets, stock markets, and the world economy is not what is being talked about as the impetuous for a rate increase, instead it is the Banks ending a 4 year fixed rate special…
There is still a 3 year 2.79, the 5 year rate remains at or near 3.19 with most lenders.
You can watch the long version at this link and gain a better understanding as to just what is going on.
Or the short version;
Prime is going nowhere, enjoy the variable. Fixed rates will move around a little bit, however have a strong likelihood of staying very close to where they are.
Kind Regards
Dustan


-
I know Mike is a very solid investor and respect his opinions very much. So if he says pay attention to this or that - I will.
~ Dale G.
-
I've started managing my own investments so view Michael's site as a one-stop shop from which to get information and perspectives.
~ Dave E.
-
Michael offers easy reading, honest, common sense information that anyone can use in a practical manner.
~ der_al.
-
A sane voice in a scrambled investment world.
~ Ed R.
Inside Edge Pro Contributors

Greg Weldon

Josef Schachter

Tyler Bollhorn

Ryan Irvine

Paul Beattie

Martin Straith

Patrick Ceresna

Mark Leibovit

James Thorne

Victor Adair