
Energy & Commodities
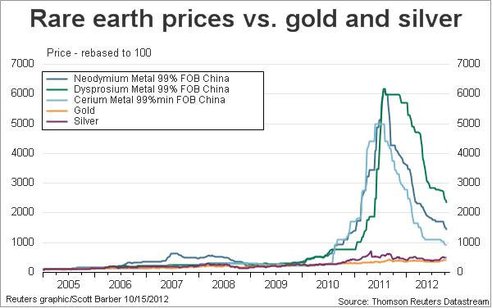
Rare earth metal prices have fallen sharply since mid-2011, some declining by as much as 80% as expectations of rising supplies coincided with declining demand. More recently, prices have shown signs of stabilising. Chinese restrictions on mine output and plans to stockpile materials, coupled with the increased likelihood of problems at mines outside China may mean rare earth metal prices are about to rise.
China reduced its export quota for rare earth metal’s by 27% year on year to 10.5kt for first half 2012 in an effort to stabilise prices and preserve stock. Then, in August, under scrutiny from the World Trade Organisation (WTO) China announced a 2.7% increase in the annual export quota, the first rise in 5 years and the highest quota for 3 years. Although the Chinese export quota for the whole of 2012 is just over 30k tonnes, exports are likely to only amount to around half that amount.
Related Article: Oil Continues Slide Ahead of OPEC Report
In July, the Chinese government announced that it would start to stockpile RMB 6 billion worth of rare earth metal by end October. In addition, there are reports from some Chinese provinces that local governments will look to stockpile rare earth metal in an effort to stabilise prices and support local businesses that got into difficulty following the collapse in prices.
Meanwhile efforts by the Chinese government to restrict illegal mining and the most polluting operators may also help support prices. In August, the government proposed new rules saying that mixed production rare earth metal mines must have a minimum annual output of 20k tonnes with smelters producing no less than 2k tonnes per annum.
Outside of China, new production from US’s Molycorp and Australia’s Lynas Corp was expected to increase the supply of the ‘light’ rare earth metals. Molycorp has reopened the Mountain Pass mine in California with output expected to rise from 3.5k tonnes in 2011 to 19k tonnes by the fourth quarter of 2012. Meanwhile, Lynas was due to start production at its Malaysian mine in October with output forecast at 11k tonnes in the first year eventually rising to 22k tonnes.
Related Article: Invest in Uranium Stocks and Watch Prices Soar: An Interview with Jeb Handwerger
However, mines outside China are not without their challenges. There is concern that Molycorp may have based its business plan on rare earth metal prices significantly higher than current prices and taken on too much debt. Molycorp invested $900 million in revamping the Mountain Pass mine (compared with 2011 revenues of $400 million) while also taking on significant debts to acquire a business in Canada. Molycorp is particularly vulnerable to declining revenues if rare earth metal prices do not rebound, potentially affecting the company’s ability to produce rare earth metal from the mine.
Meanwhile Lynas’ mine in Malaysia has been forced to delay production following a court ruling on environmental grounds. The company is facing stiff opposition from residents nearby after an earlier rare earth metal refinery was shutdown in 1992 after the local population complained of health problems and birth defects. Delays or production difficulties at either of these mines will reduce available supplies of ‘light’ rare earth metals, potentially leading to higher prices.
Companies used to order as much as 6–12 months of rare earth metals at a time. Now, they take a wait-and-see attitude ordering on a month-to-month basis to avoid downside price risk. With signs that rare earth metal prices may be stabilising on Chinese output restrictions and concerns over mine output outside China now may be a good time to revise that attitude and secure longer term.
By. Peter Sainsbury
About
Peter Sainsbury founded Materials Risk which provides commodity market insights across your supply chain. We provide news and analysis on commodity markets, highlighting the implications for business.

 Michael addresses the good news that is out there and why he is relatively positive about 2013 in this Mid-Week update.
Michael also talks about the “boiling pot” of the US Presidential Election, the uncertainty and potential that its resolution may end up replacing Ben Bernanke, his policies, as well as the subsequent effect that might have on interest rates. 6 minute audio:
{mp3}midweekupdateoct24{/mp3}

John Bogle, the legendary founder of Vanguard Group, doesn’t have high hopes ahead for financial markets.
He predicts 7 percent annual returns for stocks and 5 percent for bonds — before inflation. With his forecast for 2.5 percent inflation, that translates into real returns of only 4.5 percent for stocks and zero for bonds.
“These are the most difficult investment conditions I’ve ever seen,” Bogle tells Morningstar.com.
Editor’s Note: Prophetic Economist Warns: “It’s Curtains for America.” See Evidence.
He didn’t elaborate, but presumably he’s referring to the global economic slowdown that many experts believe will continue for several years and the massive deleveraging occurring in the United States.
So what should investors do to maximize their returns? Bogle doesn’t like the idea of taking on much more risk.
But one low-risk move you can make is switching to high-grade corporate bonds from Treasurys. That would increase your yield to a range of 2.5 to 3 percent from one of 1.5 to 2 percent.
In addition, you might extend your bond maturities. “Maybe take a little more maturity risk, which is not credit risk, just volatility risk,” Bogle says.
Other experts recommend blue-chip dividend stocks as a low-risk strategy to boost returns.
MarketWatch columnist Meena Krishnamsetty cites five stocks that offer attractive dividend yields, haven’t fallen in price this year and have seen at least one significant insider purchase.
The list includes Old Republic International, AT&T, Integrys Energy Group, DTE Energy and Alliant Energy.
…….read more Bogle Sees 7% Returns on Stocks, 2% on Bonds
The Size of Major Bull Markets

Back in 2009, we ran this Financial graphart‘s terrific chart of Bear Market Comparisons, 1929-2009. When we put it up way back in early February 2009, there were still 2 weeks left in the 2009 bear. (Its updated here).
Well, in what might not be too auspicious a sign, today we run a new chart called “The Size of Major Bull Markets”. It’s similar to the prior one, only flipped around.
via:
John Paul Koning Financial Graph & Art, October 19, 2012 www.financialgraphart.com
The Bull Case for Safe Havens

“Government securities are the default safe haven in times of heightened risk aversion. But what happens when Government finances are the cause of the tension? Where are the safe havens then?”
Dylan Grice makes the case that “over time, whats good for the currency and for government finances (bonds) should be good for the rest of the economy (equities) and vice versa.”
The problem is that the last ten years were an outlier, and that goverment bonds have benefited from their “safe haven” status:
The correlation should be positive. Indeed, the following chart shows that the correlation generally has been positive, averaging +0.2 between 1875 and 2002, but -0.3 since 2002 (for the whole period, the average was +0.15). see chart below
Given this outlier status, Investors need to be on the lookout for when government securities lose their safe haven status.

Source:
The bull case for safe havens Dylan Grice Popular Delusions Société Générale, October 23, 2012
Gold reacts more positively to post-election certainty and stability than to who’s in the office. With the presidential election only a few weeks away, the American electorate is being bombarded on an hourly and daily basis by information (some of it accurate, most of it not). With so much information out there, it can be very confusing for investors (as well as voters) to determine what’s relevant from what’s frivolous and what’s accurate from what’s misleading. In this week’s column, we will examine the current state of political and economic affairs and provide some insight into the coming election and what it means for your portfolio.
Before we delve into specifics, we have to ask the all-important question: Do presidential elections affect the markets? Unfortunately, while this is a straightforward question, the answer is not as simple as investors would like. For example, while studies show that the stock market performs better under Republicans during the first year after an election, studies also show that the market performs better during the overall four years under a Democratic president.
Specifically, markets increase 75 percent of the time under a Republican president versus 58 percent of the time under a Democratic president during the first year of office. However, during the total four-year term in office, markets perform better under Democrats than under Republicans by a factor of almost 2-to-1.
Those figures may change depending on several external factors. For example, it depends if the incumbent party loses or wins a second term. Markets decidedly favor stability and tend to perform much better during the second term of an incumbent president rather than the first term of an incoming president. Specifically, markets have historically increased by 15 percent if the incumbent president wins a second term versus a drop of 5 percent if the incumbent president loses.
So all in all, it would seem that markets favor incumbent Democratic presidents in the long term. However, this isn’t an exact science. There are so many other political factors that have to be taken into consideration, such as the political control of both houses of Congress, fiscal policy and budgetary planning.
The bottom line is that presidential elections do have an effect on the markets and your portfolio, but it is not an exact science. Therefore,we do not recommend taking portfolio decisions solely on the basis of presidential politics—it is an additional metric to use, but certainly not the only one.
Presidents, Commodities And Gold
In addition to the broader stock market performance, the outcome of presidential elections may have a significant influence on commodities markets as a whole. Let’s take a look at gold. Over the last few election cycles, gold prices have tended to drop or stay flat during the election year, only to see positive performance throughout the rest of the term. Let’s take 2012 as an example. While gold prices are up 9 percent year-to-date, that’s primarily due to an almost 10 percent rise between the months of August and September. On the flip side, you see that gold prices have actually decreased by 3 percent since late September until now, less than two weeks from Election Day.
If history is an indication, now is a good time to start loading up on gold. If you missed the recent rally, then this may be the right time for you to jump back in. With the election so close, history suggests that gold prices will begin another uptrend soon after a winner is announced.
Gold markets—unlike the broader stocks and commodities markets—don’t discriminate based on which political party enters the White House. Rather, gold markets are more interested in stability and market visibility. This has been the case throughout the last decade and looks like it will be the case in this coming cycle as well.
At the end of the day, who enters the White House is important; however, it’s not as important as the actual policies that are implemented and which will have a broader effect on the economy and the markets. The astute investor will therefore analyze the fiscal policies and budget policies implemented by the president-elect to determine how those changes will affect their portfolio. While the election is a critical moment in time, the work done after the election is the deciding factor for markets.
Disclosure: The author doesn’t have any positions in the stocks mentioned.
“Friends of Fed chief Ben Bernanke say that Bernanke may not want a second term as Fed head. The Russell opinion is that Bernanke realizes that he is losing his war against the primary trend, and that he has had enough.” “I believe the bear is angry and is re-establishing himself.”
“Many subscribers think that Richard Russell is a perpetual bear and that nothing will turn him bullish. They could not be more wrong. I call ’em the way I see ’em. In 1957 I built my business on my lone bullishness, and I wrote a bullish article for Barron’s in late 1957 which sought to prove that a bull market was still in force, despite almost universal bearishness at the time (the nation was in the throes of a severe recession at the time).”
“Back in late 1974, I stood alone as probably the only bullish analyst in the business. What I mean to say is that I call it the way I see it, based on my own reading of the market, and regardless of what the popular opinion is at the time. Frankly, I would love to be bullish today, for the sake of my business and for the sake of my five children and for the sake of the United States, the land that I love.
I’ve stated that a primary bear market started in October 2007, with the Dow at 14,164, and that the same primary bear market is still in force. The period of 2009 to its recent high was an upward correction, a ‘breather’ that came within the confines of the continuing bear market.
As I write this, I believe that the bear market is resuming. The ‘breather’ convinced many experts and name analysts that a new bull market had arrived. I disagreed. The Bernanke Fed came in with their QE4 to infinity, and that further convinced many analysts that the worst was behind us and that the Fed had the situation well in hand.
I said that we were seeing a contest between the Federal Reserve along with their manipulative efforts versus the great primary trend of the market. The more powerful of the two would be the winner. Of course, the Fed was fighting one of the most flagrant series of non-confirmations in the D-J Averages that I have ever seen.
The Dow plowed higher until it appeared that a new high in the Dow was almost guaranteed. Then, at the last minute, the market turned down, which is where we are now. As I write the Dow is down 208 points. Over recent days, the Dow has lost almost 500 points. Thus, I believe the bear is angry and is re-establishing himself.
The period between now and election time will be beyond ordinary analysis. Whether the Federal Reserve will intervene is open to question. Now something new has been added. Friends of Fed chief Ben Bernanke say that Bernanke may not want a second term as Fed head.
The Russell opinion is that Bernanke realizes that he is losing his war against the primary trend, and that he has had enough. He is ready to bow out gracefully. Thus, the Bernanke Fed may be content to step aside and allow the stock market to have its way.
(Monday), I said that I wouldn’t put it past the Fed to buy Dow stocks near the close. At one point yesterday, the Dow was down over 100 points. It struck me as very strange to see the Dow drift back to minus 10 near the close, and then at the last minute the Dow turned plus by 2 points. And this with NYSE breadth down.
Therefore, I cannot imagine a better time for the Fed to come in and buy Dow stocks or maybe buy the DIAs. And no, I’m not getting paranoid. It’s getting so that I just don’t believe anything that comes out of Washington anymore.
To put it mildly, with multi-billions of dollars involved in this crazy election, why wouldn’t the Fed be manipulating the market? The Fed has bought just about everything else, so why not the Dow?
The chart below brings the Dow up to date. The Dow is now trading completely under its 50-day moving average. RSI and MACD are at about oversold, so it would not be surprising to see the Dow rally a bit from here.

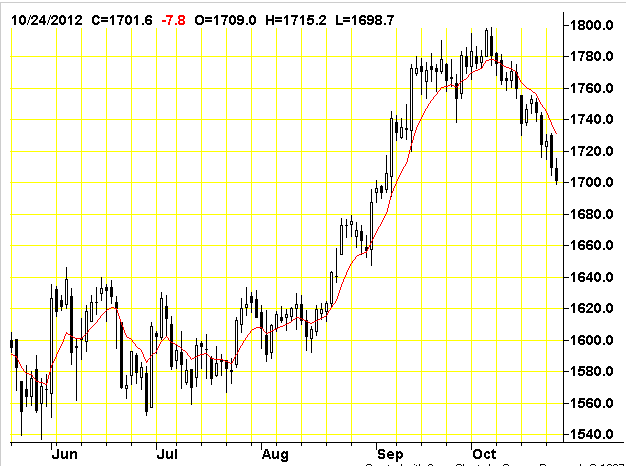
Late Notes — Gold at 1709, and still testing its 1700 support level. It’s amazing how gold dribbles down day after day but still holds its 1700 support level — at least, so far.”
To subscribe to Richard Russell’s Dow Theory Letters CLICK HERE.
Russell also offers a TRIAL. (two consecutive up-to-date issues) for $1.00 (same price that was originally charged in 1958). Trials, please one time only. Mail your $1.00 check to: Dow Theory Letters, PO Box 1759, La Jolla, CA 92038 (annual cost of a subscription is $300, tax deductible if ordered through your business).
Richard Russell publishes a detailed Daily comment, the latest Primary Trend Index (PTI) figure for the day will be posted on his web site — posting will take place a few hours after the close of the market. Also included will be Russell’s comments and observations on the day’s action along with critical market data. Each subscriber will be issued a private user name and password for entrance to the members area of the website.if you subscribe to his Letter that is published and mailed every three weeks. To subscribe go HERE
Below are two of the most widely read articles published by Dow Theory Letters over the past 40 years. Request for these pieces have been received from dozens of organizations. Click on the titles to read the articles.
“Rich Man, Poor Man (The Power of Compounding)“


-
I know Mike is a very solid investor and respect his opinions very much. So if he says pay attention to this or that - I will.
~ Dale G.
-
I've started managing my own investments so view Michael's site as a one-stop shop from which to get information and perspectives.
~ Dave E.
-
Michael offers easy reading, honest, common sense information that anyone can use in a practical manner.
~ der_al.
-
A sane voice in a scrambled investment world.
~ Ed R.
Inside Edge Pro Contributors

Greg Weldon

Josef Schachter

Tyler Bollhorn

Ryan Irvine

Paul Beattie

Martin Straith

Patrick Ceresna

Mark Leibovit

James Thorne

Victor Adair