
Gold & Precious Metals
- Worldwide money printing continues unabated

- Just In 10 years $120 trillion have been printed making global debt $200 trillion
- World GDP has gone from $32 trillion to $70 trillion 2001-2011
- Thus $120 trillion debt is required to produce a $38 trillion annual increase in GDP
- The marginal return on printed money is negative in real terms
- Thus the world is living on an illusion of paper that people believe is money
- This illusionary paper wealth will implode in the next few years
- The initial trigger will be the collapse of the world’s reserve currency – the US dollar
- The dollar is backed by $120 trillion of US government debt and probably NO gold
- All currencies will continue their race to the bottom and lose 100% in real terms against gold
- This will create a worldwide hyperinflationary depression
- All assets financed by the credit bubble will go down in real terms
- This includes stocks, bonds, property and paper money of course
- The financial system is unlikely to survive in its present form
- The banking system including derivatives has total liabilities of around $1.2 quadrillion
- With world GDP of $70 trillion, the world is too small to save a financial system which is 17x greater
- This is why there will be unlimited money printing and hyperinflation
- Gold has been money for 5,000 years and will continue to be the only currency with integrity
- Western countries’ 23,000 tons of gold is probably gone. See recent article by Eric Sprott.
- The consequence is that most of the gold in the banking system is likely to be encumbered
- This means that Central Banks one day will claim it back against worthless paper gold IOUs
- Thus gold and all other assets within the banking system involve an unacceptable counterparty risk
- Gold should be held in physical form and stored outside the banking system
- The only asset that will maintain its purchasing power is gold see chart below:

All the above via Egon von Greyerz’ GOLD SWITZERLAND website
GoldSwitzerland is the precious metals investment division of Matterhorn Asset Management AG (MAM), a Swiss asset management company specialising in wealth preservation for high net worth individuals and institutions.
GoldSwitzerland advises investors on precious metals investments and buys, sells, transfers and stores precious metals for investors. The metals are stored in the name of the clients in ultra-secure vaults in Switzerland. MAM also assists clients in transferring existing gold and silver holdings out of the banking system to the private vaults. Clients have full control of their gold and silver bars which are allocated and segregated. Clients have personal access to the vaults to inspect or collect their metals.
MAM is associated with the Aquila Group, Switzerland’s largest independent asset management group.
About Egon von Greyerz – Twitter @GoldSwitzerland
EvG forecasted the current present problems in the world economy well over 10 years ago. In 2002 when gold was $300 per ounce, MAM recommended to its investors to put 50% of their investment assets into physical gold stored outside the banking system.
Egon von Greyerz started his working life in Geneva as a banker and thereafter spent 17 years as Finance Director and Executive Vice-Chairman of a FTSE 100 company in the UK, Dixons Group Plc.
Since the 1990s EvG has been actively involved with financial investment activities including Mergers and Acquisitions and Asset allocation consultancy for private family funds. This led to the creation of Matterhorn Asset Management in 1998, an asset management company based on wealth preservation principles. The GoldSwitzerland Division was created to facilitate the buying and storage of physical gold and silver for private investors, companies, trusts and pension funds.
EvG makes regular media appearances such as on, CNBC, BBC and King World News and speaks at investment conferences around the world. He also publishes articles on precious metals, the world economy and wealth preservation.

 On US Treasuries: “Don’t tell me China will sell their US treasuries. If they sell their treasuries, the renminbi goes higher and higher and higher. And their companies that export go bust.“
That is something I have been saying for years. Indeed, the Fed and the US Treasury would be pleased to have China dump treasuries.
On Chinese GDP: “We have a roadmap from the 1920’s. The UK played the role of the US and the US played the role of China. With the leverage of the creditor cycle, UK GPP peak to trough fell 8%. One year, in America, in real terms, GDP fell 23%. That’s the leverage. Now am I sitting here with video cameras saying the Chinese economy will contract 23%? Of course I’m not. But if we have a coffee later I might say something different.“
That last sentence above generated tremendous laughter at the conference .
Negative 23% is excessively negative, but we are in the same general camp. China is going to surprise way to the downside. China will not economically pass the US as The Economist expects.
For further discussion, please see The Dating Game: Michael Pettis Challenges The Economist to a Bet on China.
There was an interesting comment on gold at the end. Hendry had been long gold and short the S&P in a paired trade since 2006. That trade worked exceptionally well through 2008. He still likes gold but not as enthusiastically as he did, and he does not like the miners.
Regarding miners, I disagree.
via Mike “Mish” Shedlock – http://globaleconomicanalysis.blogspot.com who says “The interview is well worth a play in entirety, covering Gold, Hyperinflation, Treasuries, Stocks, Japan, China, and Real Assets. It’s the best interview I have seen lately”.
Ed Note: You have to enter your email address to play, but I doubt it has to be accurate as there was no verification process.
Click HERE for the entire interview
Also:

Today we’re going to step back from the markets and take a look at the monthly charts rather than the short-term gyrations that are occurring in the markets.
They’ve all been largely trading sideways with a lack of interest by most investors as we come very close now to the elections, which are keeping a lot of investors and traders basically just trying to scalp the markets or stay out of the markets altogether.
But there have been, in the last week, some significant changes in the markets. And you really can only see them by way of the monthly charts. So today we’re going to take a look at those monthly charts.
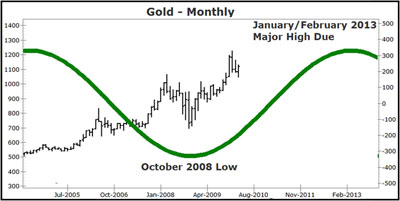
Gold: Here is the monthly chart for gold. As you can see, last week gold did hit resistance at the upper level here and has now turned lower.
This is very significant. It is what I’ve been expecting all along.
Most importantly, it is pretty amazing that — given QE III to infinity and unlimited money-printing by the European Central Bank (ECB) and the Federal Reserve — gold was unable to get above this channel resistance here and is now turning lower.
I’ve said all along that this was a bearish signal that gold could not take out the earlier high this year and last year’s November high. And as you can see, gold was unable to do that despite unlimited money-printing.
Why? Because the de-leveraging that’s occurring around the world right now is overpowering even unlimited money-printing.

So we’re not there yet for the breakout in gold. The next leg up in gold will not occur until the money-printing that’s occurring leaks out into the economy.
Right now it’s basically sitting in banks and investment banks and going back to the Federal Reserve in the way of excess deposits, excess reserves put back on the Federal Reserve’s balance sheet, and it’s doing nothing for the economy.
So you’re not seeing the wave of inflation that everyone expects. It will come, but we’re not there yet. It probably won’t come until the sovereign-debt crisis fully impacts the United States and until the Federal Reserve forces banks to start lending again. And they do have several tools to do that.
They have not employed them yet so beware anybody who tells you that the Fed is out of ammo; that’s not the case. I’ve written about this extensively before.
We’re just not at that point yet where all this money-printing is causing an increase in the velocity and turnover of money and credit and causing inflation.
Silver: Let’s take a look at the monthly chart of silver. You’ll see pretty much the same thing here.
Yes indeed we did get a rally, but silver was unable to even test resistance let alone take out its previous high earlier this year and, of course, the reaction high back in 2011. This is pathetic action in silver. And silver is indeed now starting to break down.
I still believe that silver is going to plummet through $26 and head down to $22-$21. I know I have been wrong on my timing there but I am not going to be buying silver for the next run-up — the next bull phase in silver — until we see a cyclical test of support around the $20-$22 level.
That will likely happen over the next few months, so please be aware of that.

U.S. Dollar Index: I find this awfully interesting as well. The dollar is largely going sideways but with a slightly upward bias.
Given QE III, you would think that the dollar would be plummeting to record lows. It’s not. It’s the flipside of the gold argument.
The dollar is holding its own because there’s so much de-leveraging going on in Europe and movement out of the euro and other currencies around the world into cash, which by default means the dollar. So that’s causing the dollar to have a sideways to slightly higher trading band to it.
I do expect we’re going to see a torrid rally in the dollar coming very soon where we’re going to see it project higher — up to around the 92 level basis on the Dollar Index.
Dow Industrials: The Dow Industrials on a monthly basis give you a very good indication of what’s happening here.
The Dow Industrials is firm. There’s no question about that. That is a sign of its underlying long-term strength.
But here, too, QE III has done nothing to cause the Dow to explode to new highs.
We’re still under important resistance here and the Dow is starting to look like it’s going to penetrate support at the 13,200 level. Once that happens, once we solidly penetrate support at 13,200, we can get a significant pullback in the U.S. stock markets. And I still expect that to happen.
Longer-term, I expect the Dow and the S&P 500 to inflate higher along with gold and commodities. But we’re not there yet. We’re not going to get there until all the money-printing that’s being done by the Fed starts to work its way out into the economy, and that’s not happening right now. Please keep that in mind.
Have a good week. I’ll talk to you again soon.

Inflation, Inflationary Expectations and Silver. Quantitative Easing Version 3 is “On” Thru 2015.

The Bottom Line
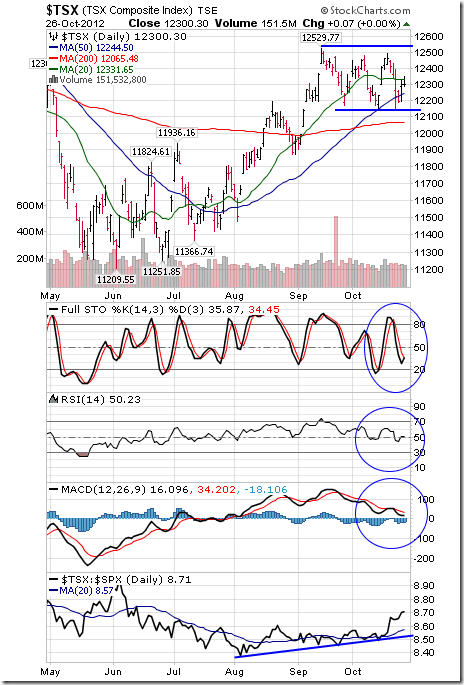
The entry point for the seasonal trade this year is here. The TSX Composite Index reached a low of 12,132 on October 15th. The low for the S&P 500 Index and Dow Jones Industrial Average has yet to be confirmed, but both indices showed evidence on Friday that they are trying to bounce from near key support levels. Downside risk is limited and upside potential into early next year is above average. Average gain during an election year by the S&P 500 Index from November 1st to February 1st is 5.0%. Preferred strategy is to accumulate equities and Exchange Traded Funds with favourable seasonality at this time of year that already are showing technical signs of performance or outperformance relative to the market (S&P 500 for U.S. markets and TSX Composite for Canadian markets). Sectors include agriculture, forest products, transportation, industrials, steel, consumer discretionary, semiconductors, home builders, China and Europe.
“For seasonal traders, this Monday is the day to buy stocks”.
Following is full text of Don Vialoux’s article in the Globe & Mail
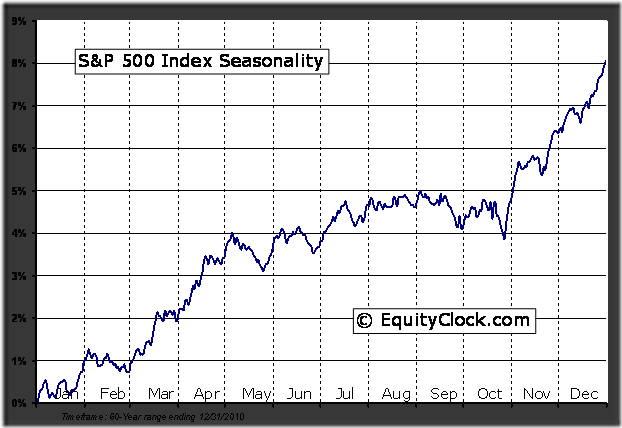
The best time during the past 61 years to enter North American equity markets has been at the opening of trade on October 28th. This year, the optimal date is the opening of trade on Monday October 29th. How does the entry point look this year?
Thackray’s 2012 Investor’s Guide notes that the best period to own U.S. equities during the past 61 years has been from October 28th to May 5th. A $10,000 investment in the S&P 500 Index purchased each year on October 28th since 1950 and sold each year on May 5th during the past 60 periods increased in value to $1,057,851 by May 5th 2011. The trade was profitable in 53 of the past 61 periods. In contrast, a $10,000 investment in the S&P 500 Index purchased each year on May 6th and sold each year on October 27th fell in value to $6,862. Calculations did not include dividends or commission costs.
The best period to own Canadian equities is identical. Data for the past 34 years shows that a $10,000 investment in the TSX Composite Index purchased each year on October 28th since 1977 and sold each year on May 5th increased in value to $200,778 by May 5th 2011.The trade was profitable in 29 of the past 35 periods. In contrast, a $10,000 investment purchased each year on May 6th and sold on October 27th fell in value to $6,674.
The main reason for the period of seasonal strength is a response by equity markets to a series of positive annual recurring events from late October to early May. Annual recurring events include transactions for tax purposes, anticipation of quarterly and annual corporate reports, the timing of analyst opinion changes, key economic reports, and special holidays, including the U.S. Thanksgiving holiday and the Christmas holiday.
The beginning of the period of seasonal strength at the end of October typically happens just after a majority of S&P 500 companies have reported third quarter results. Prior to the end of October during the third quarter earnings report period, U.S. equity markets have a history of exceptional volatility. This year was no exception.
The October 28th to May 5th favourable period of investment is best known as the “Buy when it snows, sell when it goes” strategy. By coincidence, the phrase is particularly relevant this year. Calgary experienced its first snow storm yesterday.
Negative return indicated in the data during the May 6th to October 27th periods does not imply a “Sell in May, go away” strategy. “Sell in May and go away” is a myth. The S&P 500 Index has gained in 38 out of the past 61 periods and the TSX Composite has advanced in 20 of the past 35 periods. However, gains were modest and the losses were higher relative to the period of seasonal strength. The May 6th to October 27th periods is plagued by higher volatility and fewer annual recurring events that influence equity markets.
The October 28th entry date for the annual seasonal trade is an average date. The optimal date to enter the trade each year is fine-tuned using short term momentum indicators. The optimal date normally occurs on the average date plus or minus three weeks. Last year, the optimal entry date was October 5th.
What about this October? Short term momentum indicators for the S&P 500 Index and TSX Composite Index already are oversold, but have yet to show signs of bottoming. A trigger recording a momentum buy signal is likely to occur during the next few days.
Year-end “window dressing” by U.S. mutual fund companies could have an impact on U.S. equity markets this year. Most major mutual fund companies have a fiscal year end on October 31st. Managers of these funds frequently add best performing equities prior to November 1st in order to “pretty up” their portfolio for unit holder reporting purposes. Net result is a positive bias in equity markets during the last four trading days of October.
Thackray’s 2012 Investor’s Guide notes that the last four trading days in October has recorded an exceptional return on investment in U.S. equity markets. Average return per period from 1950 to 2010 for the S&P 500 Index was 1.0 per cent. Moreover, the first three trading days in November have provided above average returns.
Given current short term oversold condition in the U.S. equity market, chances of a successful trade this year starting this Friday and continuing to November 5th are above average.
An opportunity to enter into North American equity markets at current or lower prices for a seasonal trade lasting until spring has arrived. A wide variety of Exchange Traded Funds are available that track major U.S. and Canadian equity indices.
Equity Trends
The TSX Composite Index dropped 115.68 points (0.93%) last week. Intermediate trend is neutral. Support is at 12,137.18 and resistance is 12,529.77. The Index remains above its 200 day moving average and moved back above its 50 day moving average on Thursday. Short term momentum indicators are neutral. Strength relative to the S&P 500 Index remains positive.
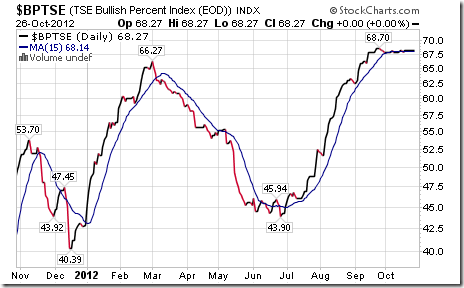
Bullish Percent Index for TSX Composite stocks was unchanged last week at 68.27% and remained above its 15 day moving average. The Index remains intermediate overbought.
Percent of TSX Composite stocks trading above their 50 day moving average fell last week to 49.00% from 57.83%. Percent continues to trend down.

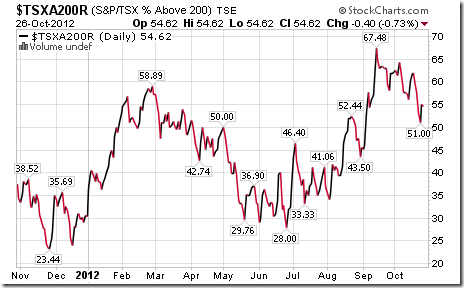
Percent of TSX Composite stocks trading above their 200 day moving average fell last week to 54.62% from 59.04%. Percent continues to trend down.
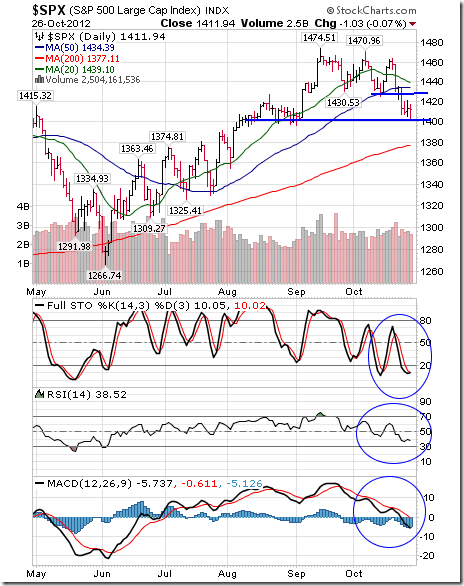
The S&P 500 Index fell 21.25 points (1.48%) last week. The Index has lost 4.25% from its September 14th high at 1,474.51. Intermediate trend is down. Support is at 1,396.56. The Index remains below its 20 and 50 day moving averages. Short term momentum indicators are oversold, but have yet to show signs of bottoming.
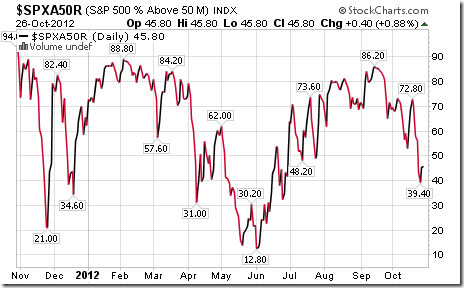
Percent of S&P 500 stocks trading above their 50 day moving average fell last week to 45.80% from 58.00%. Percent continues to trend down.
Percent of S&P 500 stocks trading above their 200 day moving average fell last week to 64.00% from 70.40%. Percent continues to trend down.

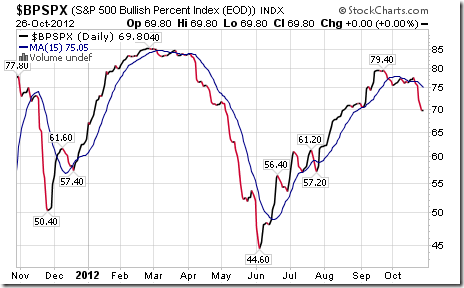
Bullish Percent Index for S&P 500 stocks fell last week to 69.80% from 76.20% and remains below its 15 day moving average. The Index remains intermediate overbought and trending down.
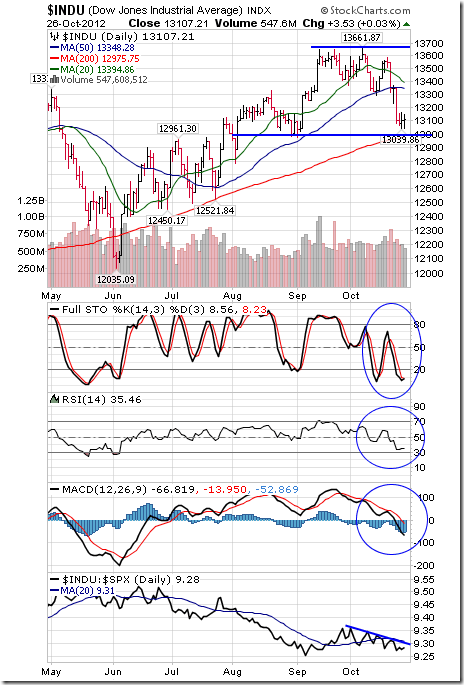
The Dow Jones Industrial Average fell 236.30 points (1.77%) last week. Intermediate trend changed from neutral to down on a break below support at 13,296.43. Next support is at 12,977.09. The Average remains below its 20 and 50 day moving averages. Short term momentum indicators are oversold, but have yet to show signs of bottoming. Strength relative to the S&P 500 Index has turned from neutral to negative.
…….read more including 45 charts and economic & earnings news this week in Don’s Monday Report HERE

-
I know Mike is a very solid investor and respect his opinions very much. So if he says pay attention to this or that - I will.
~ Dale G.
-
I've started managing my own investments so view Michael's site as a one-stop shop from which to get information and perspectives.
~ Dave E.
-
Michael offers easy reading, honest, common sense information that anyone can use in a practical manner.
~ der_al.
-
A sane voice in a scrambled investment world.
~ Ed R.
Inside Edge Pro Contributors

Greg Weldon

Josef Schachter

Tyler Bollhorn

Ryan Irvine

Paul Beattie

Martin Straith

Patrick Ceresna

Mark Leibovit

James Thorne

Victor Adair