
Timing & trends

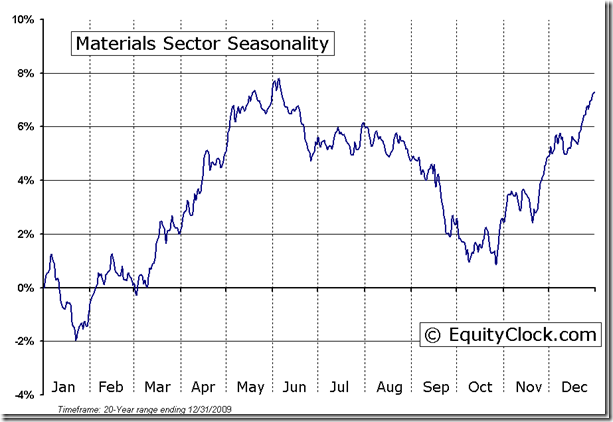
“The entry point for the seasonal trade in North American equity markets is here”
The Bottom Line
The entry point for the seasonal trade in North American equity markets is here. The TSX Composite Index reached a seasonal low on October 15th at 12,132. The Dow Jones Industrial Average reached a seasonal low on Thursday October 25th at 13,040. Downside risk is limited and upside potential into early next year is above average. Average gain during an election year by the S&P 500 Index from November 1st to February 1st is 5.0%. Preferred strategy is to accumulate equities and Exchange Traded Funds with favourable seasonality at this time of year that already are showing technical signs of performance or outperformance relative to the market (S&P 500 Index for U.S. markets or TSX Composite Index for Canadian markets). Sectors include agriculture, forest products, transportation, industrials, steel, coal, mines & metals, consumer discretionary, home builders, semiconductors, China and Europe.
Mark Leibovit Comment: “Back to the stock market, we could very well see a rally to test or even see new highs because it is either that or ‘blood in the streets’. High unemployment, a still imploding Europe and now recovery from a major national natural disaster are all potential bullish factors if you’re a contrarian. But, if it comes (50/50 in my opinion), I would not wear out my welcome”.
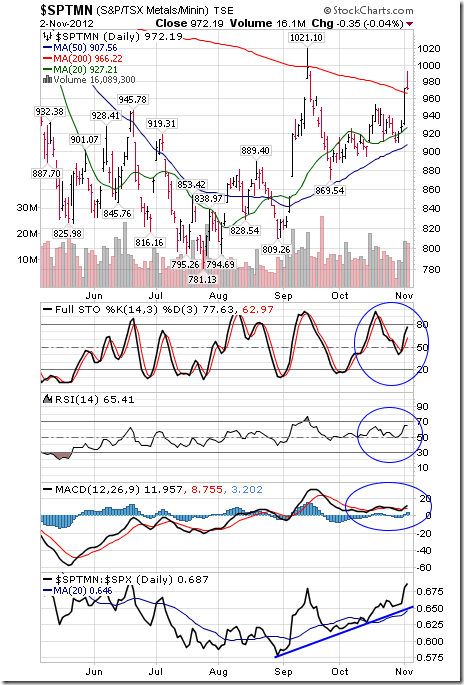
The TSX Global Metals and Mining Index added 50.55 points (5.48%) last week. Intermediate trend is up. Short term momentum indicators are trending up. The Index remains above its 20 and 50 day moving averages and moved above its 200 day moving average on Thursday. Strength relative to the S&P 500 Index remains positive.
Lumber gained another $2.42 (0.76%) last week. Intermediate trend is up. Lumber remains above its 20, 50 and 200 day moving averages. Strength relative to the S&P 500 remains positive
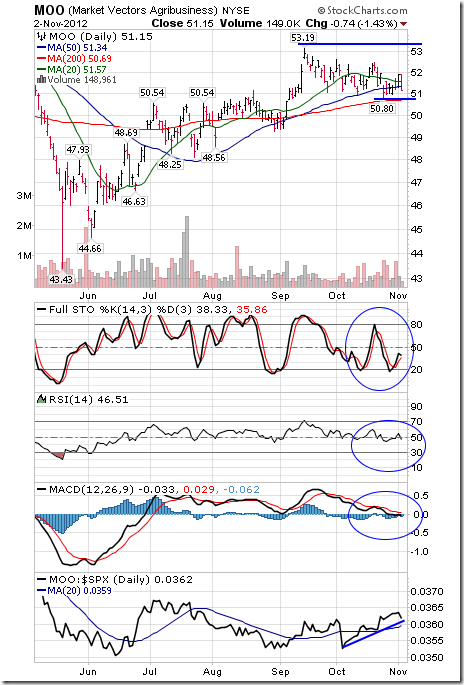
The Agriculture ETF slipped $0.14 (0.27%) last week. Intermediate trend is up. Support has formed at $50.80 and resistance is at $53.19. Units trade above their 200 day moving average, but fell below their 20 and 50 day moving averages on Friday. Short term momentum indicators are neutral. Strength relative to the S&P 500 Index remains positive. ‘Tis the season”!
Other News
The election on Tuesday is the primary focus for equity markets this week. Equity markets are expected to remain virtually unchanged on Monday and Tuesday prior to the news. Polls show the Presidential race at a dead heat. If results come down to the winner of Ohio, a final selection of the next President may be delayed until November 16th when votes triggered by absentee ballots will have been counted. Polls also suggest that Republicans will maintain control of the House of Representatives and Democrats will maintain control of the Senate. A Congressional stalemate is expected to continue after the election. Changes in Congress likely will impact attempts to forestall the “Fiscal Cliff”. Weather conditions (possible Nor-Easter on Election Day) could influence attempts to “get out the vote”.
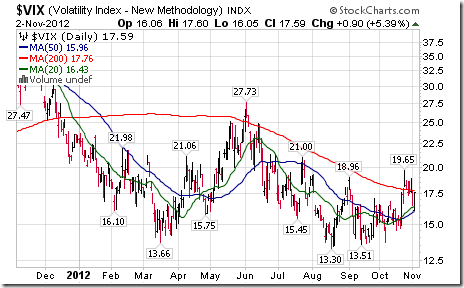
The VIX Index slipped 0.22 (1.24%) last week despite a gain of 0.90 on Friday. Intermediate trend is up.
…..read more about economic news this week & vuew 47 charts HERE

There’s a lot of news set to hit the wires this week – but none may hold a candle to what the price of oil has to say.
Since the market recovery of 2009 the price of crude has been a great benchmark for what the economy is doing. Higher crude means a rosy outlook, while lower crude stirs up “double dip” recession worries.
“It’s the oil, stupid!” would be the party platform I’d adhere to these days. With that said, let’s take a look at our crude barometer and see what the market is really saying…
For the past 24 months oil has locked into a $30 trading range from $80-110. Both above-$100 spikes occurred around increasing Middle East turbulence – where fears of a supply disruption were highest. And each low below $80 was caused by economic malaise and recession fears – bad jobs reports, manufacturing data, you name it.
Here’s a look at the chart that every oil trader needs to know…
So where can we expect to head from here? Let’s take a look at the most pressing details…
First things first, remember, oil is a physical commodity. To put the oil market in perspective today – what with Hurricane Sandy brining a physical shortage of power and commodities to the New Jersey area – it’s important to note that at any point in time the U.S. has right around 25 day’s worth of crude oil in stock.
So if there was ever a catastrophic global event, barring any release of strategic reserves, we’d have approximately 25 days of “energy-as-usual.” But after that point we’d be back to the Stone Age. Yikes! That’s the kind of danger we’re talking about when it comes to physical commodities!
Luckily over the past three decades (since the gas lines seen in 1973 and 1979) oil has been readily available. But that doesn’t have to be the case. Looking at the spikes in the chart above, it’s clear that oil traders don’t always think the outlook for global oil is all that rosy.
Looking at the big picture, here in the U.S. we’re getting an extra boost of luck (or is it skill?) from the shale oil boom. The next decade could hold turbulent times for global oil users – with a boiling Middle East and a rising China. But in a positive twist of fate, the oil pumps in America’s shale patch are bobbing up and down at a faster clip than just a few years ago.
And from what I’ve heard out in the field the breakevens for the most efficient producers are quite impressive.
The North Dakota’s Bakken formation, according to the folks at Statoil, can produce oil at $50-60 a barrel. And we could soon see over 1 million barrels of oil a day (bpd) coming from the Roughrider State.
Down in the Eagle Ford formation in South Texas, according to the folks at ConocoPhillips, oil can be produced at $37 a barrel! The Eagle Ford is the big boy on the block when it comes to new oil production for the U.S., and could produce nearly 1.8 million bpd in just a few years.
Although these breakevens may not be the norm, they do shed light on the fact that efficient producers can still make a lot of money with oil prices north of $80.
But that may not be the same sentiment coming from our neighbors to the north, in Alberta, Canada’s oil sand region.
“Amid rising costs, gyrating prices and a burst of supply competition down south” the Wall Street Journal reports, “Canadian oil companies are rethinking investment in one of North America’s earliest and fastest-growing “unconventional” oil frontiers—Alberta’s oil sands.”
“The new caution concerning oil sands in Canada” the article continues, “comes amid sharply rising costs for everything from labor to construction material and contracting. These days, even the most cost-efficient oil sands producers need U.S. benchmark prices of at least $50 a barrel to justify investment in new projects, executives and analysts figure.”
So you see, $50 is about as low as oil sand operations can go. But many of the operations, including any synthetic crude production have a breakeven closer to, or north of, $100. According to a report released this summer from Bank of America Merrill Lynch, one of Canada’s big oil sand producers may need oil over $113/barrel to bank a profit.
Add it all up, and the U.S. could find itself in a very enviable position in the North American oil game. Producing oil cheaper and more efficient could lend itself to increased production in the states and a cool down of oil-sand crude from Canada.
Profiting from this situation comes down to breakeven. And between you and me, I believe the U.S. is set to win this game – at least in the next 3-5 years with shale oil producers optimizing current production techniques.
So that’s where our oil logic stands today. Looking at the big picture if the rest of the world stays turbulent and less oil-filled than North America, and if oil sand operations don’t pose an over-supply threat, I look for prices to remain strong. You can count on spikes to the top area of that chart above.
Remember, the two million bpd upswing (coming from increased production in the Bakken and Eagle Ford) isn’t happening anywhere else in the world. And although an extra two million barrels flowing through our domestic pipelines can create a solid boom for North America, it represents only 2-3% of world oil production. That means world oil dynamics can still impact the price of oil, to the upside.
Of course a recession-based market correction could send the price of oil below the $80 mark on the chart above. But so far the price of oil has remained resilient, signaling a recession-free future.
If that remains the case, this U.S. energy trend bodes best for domestic producers. And, of course, their dividend payouts.
Keep your boots muddy,
Matt Insley
Original article posted on Daily Resource Hunter
The Managing Editor of the Daily Resource Hunter, Matt is the Agora Financial in-house specialist on commodities and natural resources. He holds a degree from the University of Maryland with a double major in Business and Environmental Economics. Although always familiar with the financial markets, his main area of expertise stems from his background in the Agricultural and Natural Resources (AGNR) department. Over the past years he’s stayed well ahead of the curve with forward thinking ideas in both resource stocks and hard commodities. Insley’s commentary has been featured by MarketWatch.
Special Report: Wait until you see what could happen in America next… An unbelievable phenomenon is set to sweep the nation… The railroad, steel, and technology age – this phenomenon triggered them all. And now it’s taking shape again! Watch this special, time-sensitive presentation now for full details on how it could affect your job… your lifestyle… and your wallet. Here’s How…

Putting Gold & Gold Stocks in Proper Context
The precious metals complex had a great rebound at the end of the summer but is now in the midst of a correction. Recently we wrote that the correction was nearing an end. We believe that to be the case. A short-term bottom could occur sometime this week. However, the precious metals sector was unable to retain much of the very strong momentum it previously had. Thus, the metals and stocks will need some time to confirm support and generate positive momentum before they have a chance of breaking to new highs. That being said, we wanted to take a broader view and analyze the sector in its current context in comparsion to the past.
Gold is likely to end up in its longest consolidation, which would surpass the 2006-2007 and 2008-2009 consolidations. Note the chart below and our observations on the three consolidations. Gold’s current position is weaker than the previous two consolidations but that won’t be of concern as long as the metal holds above the 400-day moving average at $1650. Whether Gold holds at $1650 or bottoms at $1600, the metal is likely to remain in this consolidation for a while.

Checking the gold stocks (HUI), we see that the 400-day moving average provides excellent context. The gold stocks put in a strong double bottom and rallied up to the moving average. The market is now correcting the previous overbought state. In the three previous examples, the market began its rebound off of a major bottom (2000, 2005, 2008) and encountered initial resistance at the 400-day moving average.

We focus on 2005 and 2008 because those are most applicable to today’s situation. In 2005, the HUI traded around the moving average for almost three months before pushing up to the previous all-time high. A similar thing happened in 2009. The HUI wrestled with the 400-day moving average from May until September before eventually rallying back to all-time high.
To conclude, there is nothing to be worried about in regards to precious metals. First, we should note that the shares have been showing more strength than the metals, which is always a very good sign for the near future. Second, the metals and more specifically the shares have been acting exactly as they did within a similar context in the past. After a rebound from a major low, the shares typically correct and wrestle with the 400-day moving average before embarking on a move to previous highs. Traders and investors are urged to be patient and accumulate at support when sentiment is constructive. Now while the market is wrestling with the 400-day moving average is the time to do your research and find the companies that will lead the next leg higher and outperform the market indices like the HUI, GDX and GDXJ. If you’d be interested in professional guidance in uncovering the producers and explorers poised for big gains then we invite you to learn more about our service.
Good Luck!
Jordan Roy-Byrne, CMT
Jordan@TheDailyGold.com

 As the leaves begin to turn color, we’re now three quarters through a very eventful 2012.
-
I know Mike is a very solid investor and respect his opinions very much. So if he says pay attention to this or that - I will.
~ Dale G.
-
I've started managing my own investments so view Michael's site as a one-stop shop from which to get information and perspectives.
~ Dave E.
-
Michael offers easy reading, honest, common sense information that anyone can use in a practical manner.
~ der_al.
-
A sane voice in a scrambled investment world.
~ Ed R.
Inside Edge Pro Contributors

Greg Weldon

Josef Schachter

Tyler Bollhorn

Ryan Irvine

Paul Beattie

Martin Straith

Patrick Ceresna

Mark Leibovit

James Thorne

Victor Adair