
Gold & Precious Metals
We saw some violent moves mostly on rumors about a compromise having been reached on the fiscal cliff situation last week before the holiday began. But there are no details yet to emerge thus far, at least as I’m recording this update. So let’s take a look at the longer-term trends.
There’s no change in these trends. By longer-term trends I actually mean the short- and intermediate-term trends. The long-term trends for almost all markets are substantially higher but we’re not at that point yet.
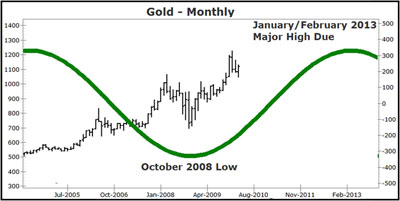
Let’s take a look at gold. This is an interesting daily chart on gold.
You can see here that gold has fallen quite substantially since Mr. Bernanke announced his QE III back in September, his infinity money-printing operation.
We’ve had a recent rally snapback, but we are coming into some system resistance that isn’t showing on this chart here that’s on my trading models — right around the $1,740, $1,735 level, up to $1,755 or so — give or take a couple of dollars.
I do expect gold to turn back down sharply and head toward the $1,600 level in the short term.

Let’s take look at the S&P 500 or the broader stock market. Pretty much the same thing here.
You can see we move down to this support level on this rising channel here. I do expect stocks to break this trendline here and, in the S&P 500, to move down to 1,286, even 1,280, and perhaps even a little bit lower heading into year-end — mostly on nervousness about the fiscal cliff.
There will be a fiscal cliff resolution, a compromise of some sort, but I don’t think the markets are going to like anything except no hike in tax increases and no spending cuts.
So it’s hard to say right now because that’s really what is driving the stock market. But technically and cyclically, I believe we’re heading lower in the stock market. And I believe that’s an indication that, whatever resolution comes out of the fiscal cliff, the market is not going to like it.

Next up, the U.S. Dollar Index. This is a longer-term daily chart of the Dollar Index.
I put this note on here, this is back in September when Mr. Bernanke announced again money-printing to infinity. And look what the dollar’s done: It’s largely rallied.
The dollar is in a nice uptrend here. There will be pullbacks along the way. I expect the Dollar Index to get up to around 83, 84 over the weeks ahead in the dollar largely against the euro. And again, no matter what happens with the fiscal cliff situation.
The reason the dollar is rallying is because disinflation is overpowering inflation in the short term.
Let’s take a look at the euro, which is really the converse of the dollar. You can see here that the euro is hanging in there. We did get up to the resistance provided by this red downtrend line from earlier in the year. But we’ve been unable to break it.
I do expect the euro to slide quite sharply heading into year-end. And as I just mentioned, (for) the dollar to rally pretty sharply heading into year-end, with the euro trading down around the 117, 115 level heading into year-end.
Again, the euro crisis is not over. It has seemed a little bit quiet recently, but there’s a lot happening behind the scenes with Greece and Spain.
France was just downgraded again by Moody’s. So there’s a lot happening there and there’s going to be a lot of downside pressure on the euro in the weeks ahead.
That’s it for this week’s update. Please stay tuned to everything I publish. The market moves we’re going to see between now and the end of the year should be very important for setting the stage for trading opportunities, not only now, but also as the new year comes upon us in just a few short weeks.
Have a good week!
Larry

Most equity markets in the world and major sectors are recovering from oversold lows set on November 16th. Selected sectors with favourable seasonal influences already are outperforming. Equity markets are set up for continuation of last week’s recovery rally that likely will last until at least Inauguration Day.
Short term momentum indicators are recovering from oversold levels and are trending up.
Currency trends could have a significant influence on equity markets this week. The U.S. Dollar virtually collapsed on Friday, but on relatively thin trading. If the fall holds early this week, it will confirm a change in momentum by the U.S. Dollar from up to down. A weaker U.S. Dollar is bullish for equity markets.
North American equity markets have a history of moving higher from U.S. Thanksgiving Day to the end of the year. A study by CNBC revealed that, on average since 1928, the Dow Jones Industrial Average has gained an average of 1.8% during this period. The trade has been profitable 80% of the time. In addition, the last week in November also has a history of outperformance by U.S. equity markets.
Europe’s decision on Greece also could be a market-mover. A decision is expected to be reached as early as today.
Economic news this week is expected to encourage equity markets (home prices, consumer confidence, Q3 GDP, Chicago PMI) with the exception of the Durable Goods Orders report
Sectors that normally show positive seasonality at this time of year continue to outperform the market including agriculture, forest products, industrials, home builders, semiconductors, biotech, China, Europe and the TSX Composite.
Every World Major Market Index Below:
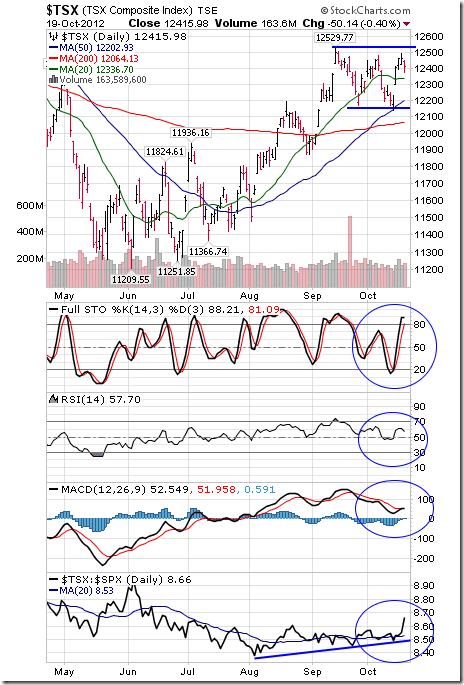
The TSX Composite Index gained 335.52 points (2.82%) last week. Intermediate trend is down. Support is forming at 11,761.34. The Index moved above its 200 day moving average and closed above its 20 day moving average on Friday. Short term momentum indicators are recovering from oversold levels. Strength relative to the S&P 500 Index has changed from positive to at least neutral.
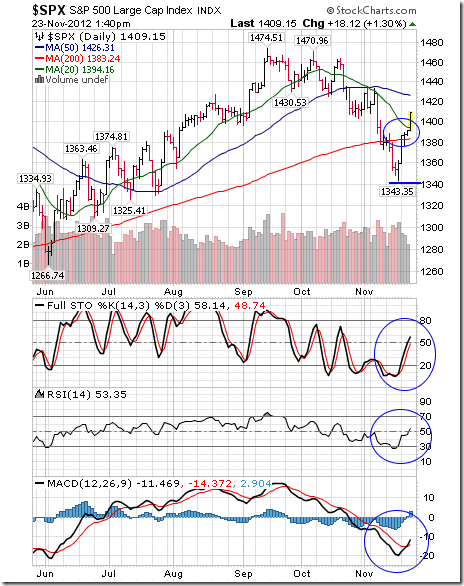
The S&P 500 Index gained 49.27 points (3.62%) last week. Intermediate trend is down. Support is forming at 1,343.35. The Index moved above its 20 and 200 day moving averages on Friday. Short term momentum indicators have recovered from oversold levels.
The Australia All Ordinaries Composite Index gained 72.32 points (1.66%) last week. Intermediate trend is up. Support is forming at 4,355.90. The Index remains above its 200 day moving average and below its 20 and 50 day moving averages. Short term momentum indicators are recovering from oversold levels. Strength relative to the S&P 500 Index has changed from positive to at least neutral.

The Nikkei Average gained 342.64 points (3.80%) last week. Intermediate trend changed from neutral to up on a break on Thursday above resistance at 9,288.53 (Japanese equity markets were closed on Friday). Short term momentum indicators are trending up. Strength relative to the S&P 500 Index remains positive.

Europe 350 iShares gained $1.93 (5.42%) last week. Intermediate trend is down. Support is forming at $35.34. Resistance is at $38.55. Units moved above their 20 and 50 day moving averages on Friday. Short term momentum indicators are recovering from oversold levels. Strength relative to the S&P 500 Index remains positive.

The Shanghai Composite Index added 0.89 (0.04%) last week. Intermediate trend is down. The Index briefly broke support at 1,999.48 before recovering. The Index remains below its 20, 50 and 200 day moving averages. Short term momentum indicators are oversold and showing early signs of bottoming. Strength relative to the S&P 500 Index changed from positive to neutral.

The Athens Index advanced 56.31 points (7.12%) last week. Intermediate trend is neutral. Support is forming at 758.03 and resistance has formed at 910.99. The Index remains above its 200 day moving average and moved above its 20 and 50 day moving averages. Short term momentum indicators are trending up. Strength relative to the S&P 500 Index remains positive.

So many more charts & comments HERE

George Soros has increased his Gold position by 47%, and his position in GDX by 130%. He also added a $9M option call position in GDX. My friend Tekoa Da Silva dissects it here. Also, recall that John Paulson increased his Gold position by 26% in Q2 2012. The big boys are getting more bullish on precious metals! – Jordan Roy-Byrne TheDailyGold.com
The Soros Position Nobody is Talking About
Just about everyone in the gold and money management communities, is aware that billionaire George Soros’ hedge fund, Soros Fund Management LLC, is heavily invested in gold and gold mining equities. Additionally, in the past few days, a flurry of new articles have been written, detailing the Soros Fund’s most recent 13-f filing. In case anyone is unfamiliar, a 13-f filing is a document which contains a fund’s investments held during a financial quarter, and when we compare a recent 13-f with a previous 13-f, we can see the buying and selling activities of a fund during a given time frame.
In the most recent 13-f filing on November 14th, the Soros fund increased its position in gold via the GLD fund from 884,400 shares, to 1.3+ million shares. That represents a sum of about $200 million. The fund increased its position in the GDX gold miners ETF from 1 million shares, to over 2.3 million, it added a 1.7 million share position in Kinross Gold, and finally, maintained a nearly 2.4 million share position in the GDXJ junior gold miners ETF.
But it seems I left something out. Along with all the other financial news editors.
The Soros Fund added what appears to be a $9 million call option position on the GDX.

What might that mean?
Well, it could mean a few things. It could mean that George Soros and his fund management team listen closely when a 100 year old man speaks. It might also mean the team felt that gold mining equities were extremely undervalued on a short term basis…and it might also mean the team sees money to be made over the next 6-12 months, via a sharp move higher in the GDX.
One thing we do not know, is the expiration date and strike price of the options. However, given the size of the fund, and size of the option position, it’s very unlikely that the options are short-term(less than 6 months), and due to necessary volume to fill such a position, they are likely “close to the money”—to use a piece of option jargon.
It’s encouraging to see one of the world’s most successful billionaire investors moving cash into the gold mining equity space, especially during a time in which many a smart market commentator has pounded the table to anyone who will listen, of the value to be had in the sector. There is no doubt great numbers of retail investors have abandoned the mining equity space this year.
We should also note many of the retail and institutional investors who abandoned their ships (positions) over the last six months, may have inadvertently been selling their holdings directly to the Soros Fund Management LLC team.
In betting who will ultimately be right or wrong from a financial perspective, I’ll be placing my bets on the Soros Fund.
Best of luck in the months ahead,
Tekoa Da Silva – Bull Market Thinking
Tekoa Da Silva is a resource investment traveler, writer and entrepreneur. He has been investing in gold since his late teens, and has built and sold a successful gold trading company. Additionally, he and has worked with some of the world’s most legendary investors and CEO’s of the world’s largest gold & precious metals mining organizations. His work has been published in a variety of sources including Entrepreneur.com, and he currently views today’s bull market in precious metals as a “once in a millennium” opportunity for proactive investors. His goal is help readers build and preserve wealth using precious metals investments and defensive asset protection strategies.

Welcome to East Africa—home of a potential 28 billion barrels of recoverable oil, 440 trillion cubic feet of gas and 14 billion barrels of natural gas liquids.
Recent success by Africa Oil (AOI-TSX; AQIFF-PINK)—the stock went from $2-$11 in just two months in the spring of 2012 on just one drill hole – has made East Africa the most exciting exploration play in the world right now.
But that excitement is tempered with some political instability, social conflict and a lack of energy infrastructure.
Still, this vastly untapped region is the fast-rising favorite for Canadian juniors. The obvious question is: Why?
The potential prize is too big to ignore:
~5 billion in proven reserves in the Sudans and major discoveries elsewhere, with only a fraction of the potential explored
Enough gas has been discovered in Mozambique to supply half of Western Europe for nearly a decade and a half—still, the country has barely been explored.
Recent offshore discoveries of some 33 trillion cubic feet of gas put Tanzania on the map, and the risk here is relatively low. Tanzania has a natural gas processing plant on Songo Songo Island, with a 70 million cubic feet/day capacity. It is also planning an LNG terminal.
Uganda discovered more than 2.5 billion barrels of oil in the last decade. This year alone, it discovered more than 1 billion barrels.

The risks fall into three categories:
1. A lack of infrastructure—pipelines, processing plants and refineries. You can make a big discovery, but how do you get it to market and monetize it?
2. Government greed.
3. Social/tribal tensions.
Sudan is a good example. Blessed with an abundant oil supplies, authorities recently announced that the country would double production in the next 2-3 years. However, it will miss its 2012 production target of 180,000 bpd due to social conflict.
Still, Canadian juniors like Calgary-based Emperor Oil (TSX-V: EM) and Statesman Resources Ltd (TSX-V:SRR) remain optimistic in Sudan.
Emperor Oil was a pioneer in Sudan, and recently signed an MOU to acquire 85% of a 50% interest in the 10,000 sq km concession Block 7 in Sudan. The other 50% is owned by the state’s National Oil Company, Sudapet.
“East Africa wants oil development,” says Emperor CEO Andrew McCarthy. “Infrastructure is an issue, though Sudan is in much better shape than most here.”
Infrastructure in this part of East Africa should improve in the coming years, with the big project being the $24.7 billion Lamu Port-South Sudan-Ethiopia Transit corridor (LAPSSET). LAPSSET includes a massive pipeline that would carry South Sudanese oil for refining in Ethiopia and Kenya and give the entire region another oil outlet.
Is it feasible? Yes, but capital is always difficult for this area, and McCarthy points out that the capacity of the Sudan-South Sudan pipeline could go to 1 million bopd at a fraction of the costs. The good news—competition creates lower costs for everyone.
McCarthy added that the new wealth being created by energy companies is a strong incentive for the different ethnic groups in East Africa to work together. He points to Sudan and South Sudan breaking apart peacefully, and any skirmishes after the fact have been stopped quickly once the oil—and hence the money—stopped flowing.
“Rather than fight over existing production they have chosen to expand their resource development so that there is a larger pie to share.”
Infrastructure is also the issue farther south in East Africa. Major energy producers are eyeing 130 trillion cubic feet of gas in the Rovuma basin offshore Mozambique, discovered by Andarko (US) and Eni (Italy). The government estimates there may be another 150 trillion cubic feet left to discover. Shell, ExxonMobil and Chevron are eyeing this as well.
But for now, there is no way to bring extracted gas onshore, no facilities to liquefy it and no infrastructure for export.
We’re talking about $20 billion in investment to build the necessary infrastructure.
And ironically, the phenomenal success of the some of the pioneering juniors causes another problem: the governments start changing terms.
Several years ago East African countries were luring foreign oil companies onto their territory with desperately attractive deals. This trend is changing. Recent reserve discoveries have empowered these nations to ask for more.
There is pressure on juniors to foot the bill for ambitious infrastructure projects. East African states want the juniors to speed up their plans—drill more wells; build pipelines—get the money flowing! It can put the juniors with limited resources in a difficult spot.
But again, The Prize is big enough that several juniors have been able to attract major oil companies into their play.
For its next licensing round in oil and gas, Kenya is planning to switch to bidding for exploration blocks, rather than its usual one-on-one negotiations. While more transparent, which is good for business, this also reflects the new impatience. Kenya is also planning to rewrite its energy policy to reflect its greater negotiating power as a result of recent discoveries.
In Uganda, potential is vast and exploration just getting underway, but regulatory challenges are mounting.
Uganda wanted its oil and gas investors to pitch in for a massive refinery in the western area of Hoima. For investors, it was an unnecessary project with unnecessary expenses. Foreign oil companies would rather see Uganda’s oil refined elsewhere, more cheaply.
With new exploration technology (FTG, 3D seismic) being used on relatively virgin reservoirs, there’s a lot of potential for big new discoveries. But there are definitely challenges for energy producers looking to move into this are.
However, the Size of The Prize trumps all—the huge capital gains enjoyed by shareholders of Africa Oil, and before them Heritage Oil (HOC-TSX), attest to that.
Investors should be watching this area to see who’s next.
– Keith Schaefer
Publisher Oil and Gas Investments Bulletin (click HERE or on the image below to read more)

P.S. I’m almost ready to release the research on my newest play — and if you’re at all interested in capital gains plus dividends, you’ll find what I’ve uncovered extremely intriguing. In fact you may not believe the new dividend payout until you see it for yourself. I’ll show you what I mean as soon as I’m finished my research, this week.


-
I know Mike is a very solid investor and respect his opinions very much. So if he says pay attention to this or that - I will.
~ Dale G.
-
I've started managing my own investments so view Michael's site as a one-stop shop from which to get information and perspectives.
~ Dave E.
-
Michael offers easy reading, honest, common sense information that anyone can use in a practical manner.
~ der_al.
-
A sane voice in a scrambled investment world.
~ Ed R.
Inside Edge Pro Contributors

Greg Weldon

Josef Schachter

Tyler Bollhorn

Ryan Irvine

Paul Beattie

Martin Straith

Patrick Ceresna

Mark Leibovit

James Thorne

Victor Adair