
Stocks & Equities
 Pretty much since the beginning of the stock market, and certainly over the last century and a half, dividends have been a substantial component of overall investment return. However, there have been some periods; the most notable during the 1990s tech boom, when investors not only lost their appetite for juicy dividends but actually came to view them with negatively. The appetite during these short-lived periods was for growth, not a paltry few percentage points income return, but double-digit, triple-digit, and even quadruple-digit growth. The perception from the market was that a dividend was a sign of slowing growth and this sent many investors out of the respective stock in search of the next big growth story.
As we saw with the tech bubble, the arrival of this flavour of investor mentality typically results in a massive contraction of overvalued prices of growth stocks. Often it can take many years for a bubble to finally burst but the when the investors turn their backs on “tried and true” methods of investing in favour of what anyone should know to be unsustainable, then that is a signal for the intelligent investors that the market is treading on unstable ground.
The truth is that in any healthy market dividends are a primary source of investment return. In fact, over the last 20 years, it is believed that dividends and income distributions have accounted for approximately 70% of total stock market returns. So by this logic, an investor who does not have a significant portion of their portfolio invested in dividend paying securities is essentially limiting themselves from assessing over half of potential returns. In an environment where market indices are posting anemic returns, the adoption of dividend stock investing has become a basic requirement for reaching financial goals or even generating a positive investment return at all.
But in the current market, many investors believe we have come full circle since the tech boom of the 90s. Interest rates are at historic lows, which have almost eliminated investment-grade bonds as a significant source of investment income. The global economic picture remains shaky which has resulted in back and forth volatility in the major stock indices, limiting or eliminating capital appreciation potential. And the result is that dividends and stocks that pay them have come back into vogue with a vengeance. So understandably many investors are now questioning whether the same type of stocks that were viewed with apathy in previous market bubbles have now become the bubble of the present day.
In many ways we encourage this line of thinking because it acts as a counterbalance to greed. However, we would also argue against the notion that dividend stocks in general have delivered such substantial performance over the past two years. In fact, if you were to take a quick look at the S&P/TSX Dividend Stock Index you would see that the price return in 2011 was negative and the price return year-to-date in 2012 is still in the low single digits. Although the Dividend Stock Index has outperformed the TSX Composite Index in both years, the level of outperformance has actually been fairly limited at less than 4% in 2011 and only about 1% so far in 2012. So it is actually pretty clear that the simple act of paying a dividend is not propelling stocks to unjustifiable prices.
Nevertheless, it is absolutely indisputable that numerous dividend stocks have produced outstanding returns over the past 3 years. So what is it that the index isn’t showing? The answer lies in a concept that has made many a great investor very wealthy and that we have been expounding for years – individual stock selection. While dividend stocks have indeed produced decent overall performance over the past 3 years, it is the individual outperformers that have been getting most of the buzz. The truth is that the payment of a dividend itself doesn’t really say anything about a company. Dividends are nothing more than a method of returning capital to shareholders. But companies that pay a dividend supported by strong free cash flow and that are able to retain and reinvest a significant portion of this free cash flow for growth have indeed exhibited very impressive performance in this largely lackluster market. In KeyStone’s research we call them Dividend Growth Stocks and as much as the income, it seems to be the growth that is infatuating investors.
For readers who are interesting in learning about the dividend growth stocks coverage in KeyStone’s Income Stock Report (ISR) research service, please visit www.keystocks.com.
KeyStone’s Latest Reports Section

Hopes and fears related to the “fiscal cliff” issue in the U.S. made for mixed performance in commodities this week. Only natural gas moved significantly. Prices for the heating fuel plunged on warm-weather forecasts. Stocks, as measured by the S&P 500, edged up half a percent in the period, taking their year-to-date gain to 12.5 percent.
Macroeconomic Highlights
Economic data in the U.S. was decidedly positive this week, but markets couldn’t look past the fiscal cliff risk. With only a month remaining before automatic tax hikes and spending cuts go into effect, politicians have yet to move toward anything resembling a bipartisan compromise. Various meetings between leaders this week have yielded nothing of substance, according to several sources.
Still, hopes are that the two parties, Democrats and Republicans, will eventually come together and strike a deal to avert the fiscal cliff given that the economic stakes are so high.
That said, for now, economic data remain encouraging. The holiday shopping season kicked off with a bang. Retail sales over the four-day Thanksgiving weekend totaled $59 billion, up 13 percent from a year ago.
Another bright spot continues to be the housing market. The S&P/Case-Shiller home price index rose by 0.39 percent in September, the eighth-straight monthly gain. Prices were up 3 percent year-over-year.
Meanwhile, pending home sales rose by 5.2 percent in October to the highest level in six years.
Finally, the Bureau of Economic Analysis reported that the U.S. economy grew by 2.7 percent annualized in the third quarter, up from its initial 2 percent estimate.

….read page 2 HERE

Produced by McIver Wealth Management Consulting Group
Mark Jasayko, CFA,MBA, Portfolio Manager with McIver Wealth Management of Richardson GMP in Vancouver.


As a general rule, the most successful man in life is the man who has the best information
In 2001 and 2002 miners were producing gold for sub-$180 cash costs – the operational cost of the mine divided by the ounces of production. By 2005 cash costs had risen 45 percent to US$250. Data from GFMS shows world gold production costs for the first half of 2009 averaged $457/oz. Average cash costs in 2011 were US$657.
According to the Thomson Reuters GFMS’s Gold Survey 2012 global gold mine production was flat (output rose 0.1 percent to 1,366 metric tons) in the first half of 2012. The average grade of ore processed globally dropped 23 percent from 2005 through the end of last year and is forecast to decline another four percent in 2012.
The report also said the average cash cost across the gold mining industry for mining an ounce of gold is a record $727 per ounce. The average cash margin dropped to $872 an ounce in the second quarter from as much as $1,032 an ounce in last year’s third quarter
Operating costs, the bullshine the industry is publishing as cash costs, are increasing, yields are declining and total expenditure has grown in line with the gold price.
Average operating/cash cost figures include only those costs directly associated with the production of the gold such as;
- Wages
- Cost of energy
- Raw materials such as steel, explosives etc

 But there’s more, a lot more to costs than most realize.
A complete breakdown of costs, an all-in cost figure, courtesy of CIBC, shows cash operating costs pegged at $700 an ounce, sustaining capital, construction capital, discovery costs and overhead at $600. Add in $200 for taxes and you get US$1500.00 as the replacement cost for an ounce of gold. Using the all-in figure provides a more accurate and definitive picture of actual mining cost and profit. Also, according to CIBC World Markets, the sustainable number gold miners need is $1,700/oz. As I write this gold is trading at $1726.00/oz.
It’s obvious that its very expensive to operate a gold mine and it’s not going to get any cheaper. The reasons behind flat-lining gold production, and record cash and all-in costs, are numerous:
- Production declines in mature mining areas
- Slower than expected ramp-ups of output
- Development time up
- The entire resource extraction industry suffers from a lack of skilled people
- Extreme weather
- Labor strikes
- Protests
Additional challenges include:
- Increasingly more remote and lacking in infrastructure projects
- Higher capex costs
- Increased resource nationalism
- Increased environmental regulation
- More complex metallurgy
- Lower cutoff grades

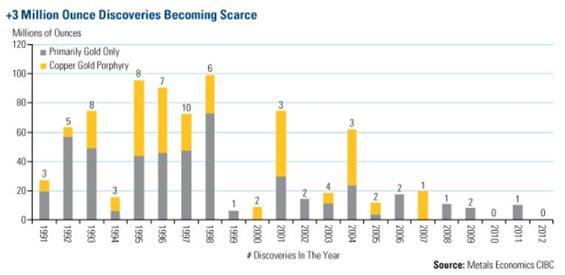
The biggest worry the industry has is that despite a significant investment in exploration (a record $8b in 2011) there’s a lack of discovery with few large high grade deposits being discovered.

Here’s some excellent insight from Brent Cook, explorationinsights.com.
“Major gold mining companies are facing a big problem. They are unable to find and develop enough ounces to keep up with demand, for the simple fact that economic gold deposits are extremely rare. Production shows a very simple trend: it rose until about 2000 and has fallen since then. This reduced production occurred even as the price of gold has increased nearly 400% in the past ten years. This incongruity tells us something fundamental: there’s a problem.
There are three main reasons why gold production increased up to 2000 despite declining gold prices.
- The first is the advent of new mining and processing technologies that made previously uneconomic low grade deposits economic. This was mostly a result of heap leach technology and bulk mining methods. Meaning, mining companies could now scrape up large areas of low grade mineralization and sprinkle a cheap solution of cyanide on the rock to recover the gold. This primarily worked on near surface oxidized deposits in relatively dry climates.
- The second is that vast regions of the world that had previously been closed for various reasons were opened up to exploration. These new areas include much of Latin America, Africa, and the former Soviet Union. I was part of that movement; we were able to walk onto obvious deposits with new eyes and rapidly drill out those resources. It also became markedly easier to get into these areas, so we were able to go deeper into the jungles and deserts.
- The third is that geologists had a whole slew of new exploration tools with which to scan the earth. These include satellite imagery, geophysics, and more sensitive chemical tools.
The net result was that new technologies kept old deposits going longer and made previously uneconomic ones viable, thereby ramping up production into the early 90’s. New deposits in previously unexplored and off-limits areas kept that production going until about 2000. All well and good but the industry is not finding as many new deposits as they need to in order to maintain current production levels. And, although we can expect incremental technological improvements in processing, mining, and exploration, there is nothing revolutionary on the horizon.
This is a worrisome slide for major gold producers—they are unable to sustain themselves. For the most part they are surviving via old deposits that are running out of ore and newer deposits that are quickly headed into the “old” deposit category. Reserves from these aging deposits are not being replaced by new discoveries. Producers’ problems are further exacerbated by rising exploration and development costs, plus the significant time it now takes to permit and finance a new deposit.”
Here’s Paul van Eeden (paulvaneeden.com) on reserve replacement, this was written in 2001:
“Worldwide gold production from mining is approximately 80 million ounces per year. A few years ago, a world-class gold discovery, which rarely occurs, would have been anything over a million ounces. Perhaps a few such deposits are discovered in a decade yet we mine the equivalent of 80 such deposits a year. Due to recent mergers and acquisition in the mining industry, the bar has been raised and the major mining companies now require deposits to be in excess of 5 million ounces before they become excited. Perhaps only one or two such discoveries are made in a decade.
Anglogold mines over 6 million ounces of gold a year. Newmont mines roughly 4 million ounces of gold a year, Barrick 3, Harmony almost 3, Normandy 2, you get the picture. Each of these companies need to make a world-class discovery every year, and some of them need several, just to prevent the natural depletion of their mineral reserves from retiring the entire business. Note that mergers and acquisitions do not add any new resources to the mining industry, it merely changes the ownership of mines. The gold mining industry needs to discover 80 million ounces of gold every year just to prevent it from shrinking and it is highly unlikely that we will ever discover 80 million ounces in any given year, never mind do so on a continuous basis.”
Barclays Plc predicts global gold mine output may increase 0.7 percent in 2013, the slowest pace since 2008, while forecasting total physical supply may shrink 0.4 percent in 2014.
Gold miners have been able to survive rising costs because of rising gold prices – if gold prices do not start going up marginal projects are not going to get funded and a whole lot of forecasted gold production is not going to come on stream.
Global gold demand in Q3 2012 was 1,084.6 tonnes (t), slightly above the five year quarterly average of 984.7t, according to the World Gold Council’s Gold Demand Trends Report.
“Gold is beginning to re-establish itself as part of the fabric of the financial system. In the medium term, the quantitative easing initiatives in the West and the continuing growth story in the East, particularly in India and China, coupled with the seasonally strong quarter coming up in Asia, are excellent indicators for further growth in the gold market…it is clear from five year rising demand trends that gold’s fundamental property as a vehicle for capital preservation continues to endure, as evidenced by this quarter’s increase in global ETF investment, up 56% and continued purchasing by central banks, the ultimate long term investors.”Marcus Grubb, Managing Director, Investment at the World Gold Council
From Sy Harding, over at streetsmartreports.com, comes some important information on the state of the U.S. economy:
“The CFNAI is an index comprised of 85 established economic indicators and trends drawn from all areas of the economy. It was first compiled in 1967 and has a remarkable record for identifying early on when the economy has entered a recession.
The numbers are reported monthly. A positive level for the index indicates the economy is growing, while a negative number indicates the economy is slowing.
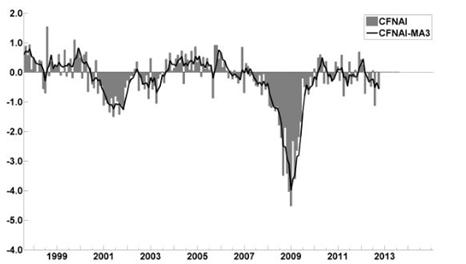
The index has been of concern for a while. The monthly reading of the index was in negative territory for five consecutive months before improving to the flat-line at 0.0 in September.
Unfortunately, that improvement lasted only one month. The report this week shows a sizable drop to -0.56 in October.
More ominously, it’s more important 3-month moving average also dropped to -0.56 in October from -0.36 in September. It was its 8th straight month of negative readings, and getting ominously close to the -0.70 level the Fed considers “an increasing likelihood that a recession has begun.” It is the solid line in the Fed’s chart.
The index has only dropped beneath the recession warning level of -0.7 eight times since 1967. That was in 1970, 1974, 1980, 1981, 1989, 1990, 2001, and 2008. Each time the economy was indeed in a serious slowdown, usually a recession, and seven of those eight times the stock market was already in a bear market or soon rolled over into one. The most recent occasions were in 2001 and 2008, certainly not pleasant memories for the country.
The financial media and investors don’t pay much attention to the CFNAI, and most of the time it is not of much importance.
But with the 3-month moving average in negative territory for 8 straight months, and now at -0.56, so perilously close to -0.70, it should have everyone’s attention.”
From Axel Merk, over at merkinvestments.com, comes three key reasons to support an investment in gold:
- A form of protection against inflation
- Safe haven investment
- Minimize downside deviations in the value of an overall portfolio, reduce overall volatility, and enhance returns
“Over recent years, gold has performed remarkably well relative to other asset classes, in terms of both absolute performance and risk-adjusted performance. Over the preceding 10 years, an investment in gold would have significantly outperformed a corresponding investment in the S&P 500 Index or U.S. bonds, not to mention international and emerging market equities. Over the past 10 years, gold outperformed U.S. equities by over three times.
On a risk-adjusted basis, gold has produced superior returns, as measured by the Sharpe ratio. Over the 10-year period ended September 30, 2012, gold’s performance generated a Sharpe ratio of 0.85. In comparison, the S&P 500 Index generated a Sharpe ratio of just 0.30, as did international equities.
Gold’s Sharpe ratio was nearly as high over the five year period, as it was over the 10-year period ended September 30, 2012, while comparable equity indices produced negative Sharpe ratios. In fact, over each time period analyzed, gold outperformed domestic and international equities on a risk-adjusted basis.”
merkinvestments.com
“The disadvantage of fiat money [.i.e. non-convertible money], relative to commodity money, rests precisely in the fact that its scarcity, being thus contrived, is also contingent. A matter of deliberate policy only, it is subject to adjustment at the will of the monetary authorities or, if those authorities are bound by a monetary rule, at that of the legislature. Consequently, although a fiat money can be managed so as to not only preserve its purchasing power over time, but also so as to achieve the greatest possible degree of overall macroeconomic stability, there is no guarantee that it will be so managed, and market forces themselves offer no effective check against its arbitrary mismanagement.” economist George Selgin

Conclusion
It’s very clear that over the last decade gold has been a very good investment, and will continue to be so for the foreseeable future, but there is one asset class that will do even better than bullion, a lot better.
As mentioned previously, producers are not able to replace their reserves because there’s a lack of discovery, few large high grade deposits are being discovered and most of those that have been discovered aren’t owned by producers …
“Today, the major producers and their majority-owned subsidiaries hold 39 percent of the reserves and resources in the 99 significant discoveries made in the past 15 years.” Metals Economics Group (MEG)
Only 39 percent, so who owns the other 61 percent, who actually owns the worlds future gold supply?
A Junior exploration company’s place in the food chain is to acquire and explore properties. Their job is to make the discoveries that the mid-tiers and majors takeover and turn into mines. Junior exploration companies own the majority of the world’s future gold mines.
But the bottom line is, new exploration, despite a record amount of money being thrown at it, is not keeping up with reserve depletion. Juniors are not getting enough funding to do the necessary exploration to keep up – from June 2011 to June 2012 funding for juniors has dropped by $9b.
It’s time to be a stock picker, you need to find the quality management teams with money in the treasury, the ability to raise more and having the advanced projects that are well along the development path towards a mine. A mine that is going to be a long life, lowest quartile all-in cost producer. These companies are the world’s future gold producers and of course most will be in the sights of mid-tier and major producers for takeover candidates as reserve replacement targets.
I’ve got several precious metal juniors that fit that very specific bill on my radar screen, do you have any on yours?
If not, maybe you should.
Richard (Rick) Mills
Richard is the owner of Aheadoftheherd.com and invests in the junior resource/bio-tech sectors. His articles have been published on over 400 websites, including:
WallStreetJournal, SafeHaven, MarketOracle, USAToday, NationalPost, Stockhouse, Lewrockwell, Pinnacledigest, UraniumMiner, Beforeitsnews, SeekingAlpha, MontrealGazette, CaseyResearch, 24hgold, VancouverSun, CBSnews, SilverBearCafe, Infomine, HuffingtonPost, Mineweb, 321Gold, Kitco, Gold-Eagle, The Gold/Energy Reports, Wealthwire, CalgaryHerald, ResourceInvestor, Mining.com, Forbes, FNArena, Uraniumseek, FinancialSense, Goldseek, Dallasnews, SGTReport, Vantagewire, Resourceclips, Indiatimes, ninemsn, ibtimes, jsmineset and the Association of Mining Analysts.
If you’re interested in learning more about the junior resource and bio-med sectors, and quality individual company’s within these sectors, please come and visit us atwww.aheadoftheherd.com
***
Legal Notice / Disclaimer
This document is not and should not be construed as an offer to sell or the solicitation of an offer to purchase or subscribe for any investment.
Richard Mills has based this document on information obtained from sources he believes to be reliable but which has not been independently verified.
Richard Mills makes no guarantee, representation or warranty and accepts no responsibility or liability as to its accuracy or completeness. Expressions of opinion are those of Richard Mills only and are subject to change without notice. Richard Mills assumes no warranty, liability or guarantee for the current relevance, correctness or completeness of any information provided within this Report and will not be held liable for the consequence of reliance upon any opinion or statement contained herein or any omission.
Furthermore, I, Richard Mills, assume no liability for any direct or indirect loss or damage or, in particular, for lost profit, which you may incur as a result of the use and existence of the information provided within this Report.

Waterfloods: The Next Big Profit Phase of the Shale Oil Revolution:
The Shale Revolution has turned many retail investors into millionaires. It’s one of the few long-term trends where Wall Street didn’t make ALL the money!
New tight oil plays are still being discovered—especially in Texas, with the Eagle Ford, Eaglebine and Cline shales.
But everybody is now starting to understand that these shale plays/tight oil wells decline really fast. Whenever you hear about an eye-popping flow rate of 3,000-4,000 barrels a day from a well in the Bakken, consider that these wells can decline 80% in the first year!
That got me thinking: How long can companies grow with those declines? When I started researching this, I discovered what will be Phase II of the Shale Revolution—and it’s a lot more profitable than what we’ve seen so far.
It is arguably the cheapest and most profitable oil North America has ever seen—and in Canada, it’s now “flooding” into the market, as producers once again use old technology to create a wave of new profits. The U.S. will be three to five years behind because producers are—as I said— still finding new plays.
Canadian producers are using “waterfloods”—pushing water into underground formations to flush a large amount of oil out to nearby producing wells—to increase production and profits.
It’s the next big money-making phase of the Shale Revolution.
Waterflooding has been around for 70 years or more, but the Big Question over the last five years has been, can you do it effectively with tight oil?
The answer is a big “Yes,” and waterflood potential has become so important that institutional investors now see them as major share price catalysts for junior producers in Canada—and track them closely.
Waterfloods start one to two years after drilling the well, in a time window producers call “secondary recovery.” (Drilling is primary recovery.) Waterfloods are cheap to try and cheap to run (with most operations costing just $5-10 per barrel!), and now the industry is seeing that they are sometimes doubling reserves from a well.
“Secondary recovery is where you really make all your money in this industry,” says Dan Toews, VP Finance and CFO of Pinecrest Energy (PRY-TSX.V).
Pinecrest is very vocal about their waterflood potential. They say they can double the amount of oil they recover (called the Recovery Factor, or RF) from a well—at less than $15/barrel—half the price of primary recovery costs, which are over $30/barrel.

“Everyone is trying to find a new resource play,” says Toews. “First you find a resource, and then you drill it like crazy. But the second stage is to go in for your secondary recovery, through waterflooding of some kind if possible.”
To date, Pinecrest isn’t yet flowing even one barrel of waterflooded oil — so their powerpoint slide is just projections. Toews and his team expect to be waterflooding all of their operations by the end of this quarter. But analysts are already seeing the waterfloods as a share price catalyst.
“Just about every investor and institution we talk to wants to know the status with our waterfloods,” says Toews. “The buyside (fund managers= buyside, brokerage firms=sell side — ed.) is very savvy on waterfloods. Once we apply the method, this is what has the potential to shoot up our share prices.”
Realistically, the effects can be seen within 2-3 months, but it’s best to give them a year — or more — of operations before judging their impact. Waterfloods can last up to 20 years or more.
Another Canadian oil junior, Raging River Exploration (RRX-TSX), also explains the waterflood potential in their powerpoint. They expect to be swimming in 1 million EXTRA recoverable barrels of oil per square mile, courtesy of waterfloods — at an even cheaper cost of $5-10 barrel, vs $30 barrel for the first 600,000 barrels.
Raging River is developing the Viking formation in SW Saskatchewan — a large, tight oil play that since the 1950s has had an improved outlook from 2 billion barrels of oil to an estimated 6 billion barrels of oil in place, all thanks to horizontal drilling.
Raging River expects waterflooding to increase its RF from 8% from primary recovery methods (drilling vertical and horizontal wells) using 16 wells/section, to 16-20%. The simple math says that will increase the number of barrels recovered from 480 million at 8% to 1.25 billion at 20% RF.
If Raging River — or any producer — can show a steady RF for over a year, I would suggest to investors those barrels will be worth $10-$15 each — creating huge value to shareholders on a buyout.
Some Viking waterfloods have even seen results as high as 30% RF.
“A small change of recovery over a large oil field is significant and adds a tremendous amount of value,” says Scott Saxberg, President and CEO of Crescent Point Energy (CPG – TSX), arguably seen as the industry leader in the waterflooding revival.
“A lot of these unconventional plays (tight oil) are in high decline. By implementing waterfloods, we can lower the declines in the field, and increase reserves. There’s huge value to that.”
Crescent Point started waterflooding its properties five years ago when multi-stage fracking (MSF) was new on the scene. Now they have five years of knowledge that the method works, and that they can use it across all of their fields.
“We recognized right away to implement a strategy to increase the recovery factor on a multi billion barrel pool,” says Saxberg. “If you change even 1%, that ends up being huge.”
“Waterflooding is the next step past in-fill drilling (ie. drilling more holes in less space to increase ultimate recovery). It takes a lot of time to accrue knowledge and data on how to properly implement it. The sooner you start, the better data you have.”
According to Saxberg, waterflooding is more than just a cheap way to float balance sheets.
Over the course of Crescent Point’s five-year waterflooding program, they’ve developed hundreds of different combinations of waterflooding techniques coupled with fracking techniques, well spacing and plenty of other factors.
“Water flooding is basic, in that you pump water into the ground,” says Saxberg. “So to enhance that, you have to look at what type of patterns are in your reservoir. Now these are unconventional tight reservoirs, so the question was, can they actually be water flooded?”
Again, the Big Answer is Yes, and management teams are now using the promise of waterfloods as a cheap way to float their balance sheets earlier in a resource play. But Saxberg says waterfloods are truly more long-term value.
“They are a long term day-after-day technical grind and process. So it’s not the same as drilling a well and seeing 100bbls/day. It’s a lot of ups and downs and a lot of long term view.”
There’s only one negative here that I see — how will all that cheap oil affect North American pricing, when the continent is already swimming in the stuff?
In the short term, the pro-forma economics of waterfloods are making a splash with both management teams and the market.
But medium term and beyond, it will create a quandary for juniors — the easy money comes after huge capital spending.
I’ve done the research on the top Canadian juniors that will be poised to benefit the most from waterfloods.
Click here to download this free stock report, while you can!
– Keith
About Oil & Gas Investments Bulletin
Keith Schaefer, Editor and Publisher of Oil & Gas Investments Bulletin, writes on oil and natural gas markets – and stocks – in a simple, easy to read manner. He uses research reports and trade magazines, interviews industry experts and executives to identify trends in the oil and gas industry – and writes about them in a public blog. He then finds investments that make money based on that information. Company information is shared only with Oil & Gas Investments subscribers in the Bulletin – they see what he’s buying, when he buys it, and why.
The Oil & Gas Investments Bulletin subscription service finds, researches and profiles growing oil and gas companies. The Oil and Gas Investments Bulletin is a completely independent service, written to build subscriber loyalty. Companies do not pay in any way to be profiled. For more information about the Bulletin or to subscribe, please visit: www.oilandgas-investments.com.


-
I know Mike is a very solid investor and respect his opinions very much. So if he says pay attention to this or that - I will.
~ Dale G.
-
I've started managing my own investments so view Michael's site as a one-stop shop from which to get information and perspectives.
~ Dave E.
-
Michael offers easy reading, honest, common sense information that anyone can use in a practical manner.
~ der_al.
-
A sane voice in a scrambled investment world.
~ Ed R.
Inside Edge Pro Contributors

Greg Weldon

Josef Schachter

Tyler Bollhorn

Ryan Irvine

Paul Beattie

Martin Straith

Patrick Ceresna

Mark Leibovit

James Thorne

Victor Adair