Both Gold & the US Dollar have declined in tandem since mid-November. That raises the question…..
WHAT CAN HAPPEN WITH GOLD IF THE DOLLAR COLLAPSES?


Today’s essay is the first one in our two-part commentary on U.S. debt and the dollar collapse.
On numerous occasions we have gone back in our commentaries to the year 1971 and U.S. President Richard Nixon’s decision to cut off the ties between the greenback and gold. Today, we revisit the topic once more and check what kind of implications it has for the price of the yellow metal.
Prior to 1971 the most prominent world currencies had been regulated by the Bretton Woods system. Under this agreement, the U.S. agreed to link the dollar to gold. This meant that any amount of dollars handed over by a foreign government or central bank would be exchanged for gold at $35 per ounce. Such an arrangement had a particularly important consequence for money creation. Namely, the U.S. government shouldn’t issue more paper money than it had physical gold to back this money up. In practice, it was rather improbable that all the dollars would have to be exchanged for gold at once, so the U.S. government in fact issued more money than it could have paid for with gold, but the main restriction was in place: debt numbers couldn’t be inflated to unsustainable levels.
In 1944 when the Bretton Woods system was introduced, the relation of U.S. debt to the official Treasury gold reserves stood at $319.90 per ounce of gold. This meant that there was $319.90 of borrowed money for every ounce of gold the U.S. had. With the price of gold at $35, a quick calculation shows that the U.S. gold reserves could have paid for about 10.9% of its debt. At first, it might seem that there was a lot of debt compared to gold assets. On the other hand, however, such a ratio was similar to reserves required from commercial banks by the regulator. In a way, the U.S. operated like a bank (with a lot of differences, of course).
By 1970, partly due to the Vietnam War, the U.S. began running consistent deficits. The government printed more dollars to meet its obligations and the amount of debt per ounce of gold surged to $1,172.56. The coverage of debt in gold went down to 3.1%. The ability of the U.S. to keep up to the promise to exchange dollars for gold was put into question. Nixon, fearing a situation in which foreign central banks would make a collective bank run on Fort Knox, decided to cease to exchange the dollar for gold and directly break the Bretton Woods agreement.
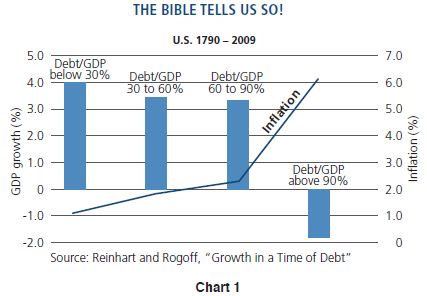
From that moment on, the dollar has been a fiat currency, that is a currency not backed by a physical asset, just by a promise of the government to accept payments (taxes) in it. But, as we’ve just seen, promises can be broken and right now the ability of the U.S. to pay its debts off in the future is also being put into question. To see why, take a look at the chart below.

Since 1970 U.S. debt has gone up from $370.9 bln to $16,159.5 bln, which is a more than 41-fold increase (!). Since 2000 gold has appreciated along with the ever sharper increase in debt. A similar chart was discussed in our commentary on gold as insurance.
Our next chart shows the rates of change (ROC) of both the U.S. debt and the average annual price of gold between 1920 and 2012.

The annual ROC of U.S. debt was in a general downtrend in the 1983-2000 period which was accompanied by poor performance of gold. Since 2000, the ROC of U.S. debt has been increasing again, which means that debt has been growing increasingly rapidly. This coincided with gold’s extraordinary performance during the last 10 years.
The U.S. Federal Reserve, led by Ben Bernanke, initiated three substantial rounds of what it callsquantitative easing (QE). In short, QE is a process in which the Fed buys government bonds and other assets from secondary markets with newly created dollars. Its (official) purpose is not to finance government deficits but rather to bring the U.S. economy back on the growth trajectory. Nonetheless, the effects of QE can be compared to those of printing enormous amounts of money. Just to give you an idea of how much debt the consecutive rounds of QE have so far created (approximate amounts):
- QE1 (Nov 2008 – Mar 2010): $1.65 trillion
- QE2 (Nov 2010 – Jun 2011): $600 billion
- QE3 (Sep 2012 – ?): $40 billion per month.
As a matter of fact, Fed’s quest to provide the economy with more incentives has not stopped. The direct effect of QE on debt is reflected on the chart below.

In the period between January 2012 and November 2012 U.S. debt grew by 7.2%. There’s more to it: QE3 is an open-ended operation. This means that there is no limit on the amount of money the Fed can create and inflate the debt with within QE3. The purchases in the amount of $40 billion per month will continue as long as the Fed deems necessary.
The points mentioned above add up to a picture which is not at all rosy for the U.S. But it’s not apocalyptic either. Particularly for precious metals investors. Let us explain why.
It belongs to common sense that you can’t borrow money forever. Economics has a lot of intricacies and can be quite complicated at times but the basic rules are very simple. You borrow, you have to pay back. So if the government borrows too much and can’t pay it back, it will have to go bankrupt. The more debt it has, the worse its reputation is. People are less willing to put their money into treasury bills of a government with excessive debt. If the economy is shaky and the government is printing money, it damages its reputation but also makes the currency worth less and less. Hyperinflation is not a default nor bankruptcy in technical terms, but it is in practical terms. For the USD bond holders it will make little difference if they are not paid or paid something that is worthless.
In such an environment investors, motivated psychologically, turn to gold and silver. As Warren Buffet correctly pointed out:
“[Gold] gets dug out of the ground in Africa, or someplace. Then we melt it down, dig another hole, bury it again and pay people to stand around guarding it. It has no utility. Anyone watching from Mars would be scratching their head.”
But there’s one side of precious metals that is not covered by that quote. Gold and silver may be just lumps of metal but what makes them extremely interesting is the psychological association people have with them. Gold and silver have been used as currencies throughout the centuries. And people, for whatever reason, perceive them as valuable, particularly in times of economic turbulence. This alone stipulates that gold and silver prices may rise along with the worsening of the economic situation. And in case of the unlikely collapse of paper currencies, gold and silver could quite naturally come in as the base of a new monetary system.
The possibility we would like to highlight now is the default of the U.S. on its obligations and the demise of the dollar. In this scenario, a new currency system based on the gold standard is introduced. The financial collapse is usually perceived as Armageddon but doesn’t necessarily have to be one. Just imagine, even in case of the U.S. government defaulting on its obligations, the assets that the country has would remain in place. The buildings, cars and infrastructure would still be there, they wouldn’t melt down in the possible financial crisis.
A lot of property would change hands and there definitely would be turmoil, but it wouldn’t need to amount to a civil war. Take a look at Latvia, a country where the GDP between 2007 and 2009 shrank by 24%, where unemployment shot up to 30% in 2010. Where the government laid off 30% of the civil servants and cut payrolls by 40%. Latvia didn’t disintegrate.
So what implications for gold would a collapse of the U.S. dollar have? The next chart will aid us to analyze such an occurrence.

This chart presents the already mentioned relation of U.S. debt to Treasury gold reserves – the amount of debt per one ounce of gold – up to 2012. The red line represents U.S. Treasury gold reserves in metric tonnes, while the yellow line denotes the amount of U.S. debt in dollars per ounce of gold. The debt per ounce has visibly increased since 1971, accelerating around 2000 and even more around 2008. In 2012, there were $61,796.11 of debt per one ounce of gold owned by the U.S. government.
Now, if a new gold standard is introduced and the agreement works like the Bretton Woods system, the dollar (or whatever other currency) would be tied to gold. As noted earlier in this essay, at the introduction of the Bretton Woods agreement in 1944 the debt coverage for the U.S. stood at 10.9% (or $319.90 of debt per one troy ounce of gold). If the new system were based on similar assumptions with debt coverage at 10%, this would imply a fixed price of $6,179.61 per ounce of gold ($6,179.61 per ounce of gold divided by $61,796.11 of debt per one ounce of gold gives us coverage of 10%).
But is the dollar collapse all that likely? Or let us restate the question: if the dollar doesn’t collapse, does it still make sense to be invested in gold and silver? Bear with us until next week when we publish the second part of this commentary. Until then you can gain some more insight into why holding on to precious metals might keep you on the safe side by reading our essays on gold and silver as insurance and on gold and silver portfolio structure.
Thank you for reading.
Przemyslaw Radomski, CFA
Don’t fight the emotionality on the market – take advantage of it! – Przemyslaw Radomski, CFA
About Sunshine Profits
Sunshine Profits is built around the belief that we are in a secular bull market in all commodities and that precious metals will be among its greatest beneficiaries. Having established long term trends, our investment strategy focuses on evaluating low-risk entry points, as well as timing potential tops.
“Does something really work over the long run?” — that’s the big question we strive to answer.
We’re proud of the value that SP proprietary indicators, tools and weekly market analysis bring to our customers. We are proud to be the first to find important, but still largely unknown relations, that influence gold prices, such as the one combining seasonal tendencies with expirations of derivatives.
We understand that quality doesn’t come cheap. We spend many, many months on research and development of each of our tools — and we leave nothing behind, we give our best to you. That’s why, as our valued customer, you can be confident: what you get from us is always of greatest quality, usefulness and profitability.


 ….Bill Gross sees 4 Key Structural Headwinds going forward. They are:
 Jim Rogers is still shorting bonds, favors silver over gold and is looking for ways to go long on Russia.


