
Currency
The Pieces Are In Place For A Gold Rally
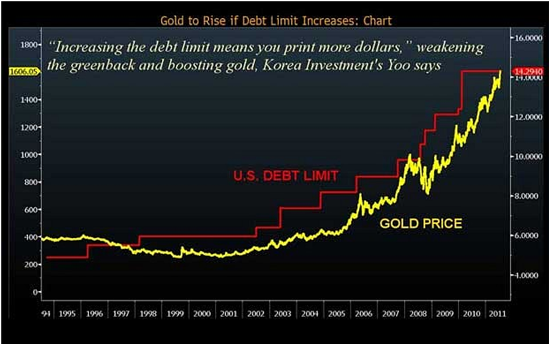
Tom Cloud of National Numismatic Associates, he explains why the upcoming debt limit negotiations are a bigger deal than the fiscal cliff for precious metals.
DollarCollapse: Hi Tom. How’s business? Specifically, what are your customers thinking about?
Tom Cloud: The phone is ringing off the hook. Our customers are less concerned with the fiscal cliff being kicked down the road than with the fact that the debt ceiling is just a couple of months away. I’m also hearing a lot of complaints about president Obama cutting the fiscal cliff deal and then immediately charging taxpayers $3 million to take him and his family to Hawaii.
…..read more HERE

As long-time students of precious metals investing, there are certain things we understand. One is that, historically, the availability ratio of silver to gold has had a direct influence on the price of the metals. The current availability ratio of physical silver to gold for investment purposes is approximately 3:1. So, why is it that investors are allocating their dollars to silver at a much higher ratio? What is it that these “smart” investors understand? Let’s have a look at the numbers and see if it’s time for investors to do as a wise man once said and “follow the money.”
Average annual gold mine production is approximately 80 million ounces, which together with an estimated average 50 million ounces of annual recycled gold, totals around 130 million ounces available per year. In comparison, annual mined silver production has averaged around 750 million ounces, while recycled silver is estimated at 250 million ounces per year, which adds up to approximately 1 billion ounces. Using this data, there is roughly 8 times more silver available to buy than there is gold. However, not all gold and silver is available for investment purposes, due to their use in industrial applications. It is estimated that for investment purposes (jewelry, bars and coins), the annual availability of gold is roughly 120 million ounces, and of silver it is 350 million ounces. Therefore, the ratio of physical silver availability to gold availability is 350/120, or ~3:1.1
Now, let’s examine how investors are allocating their investments between gold and silver. The data below is from the US Mint showing gold and silver sales in ounces:
As you can see, investors are choosing to buy silver at a ratio to gold that is well above what is available. This uptrend doesn’t show any signs of slowing either. The ratio of the physical silver to gold is both rising and extraordinarily above the availability ratio of 3:1.
We can also use other data such as the most recent issues of the Sprott Physical Gold and Silver Trusts. The last Gold Trust issue in September 2012 raised US$393 million and the last Silver Trust issue raised US$310 million. On the basis of prices for each metal at the time of issue, we could purchase ~213 thousand ounces of gold and ~9.1 million ounces of silver. This represents a purchase ratio of 43:1.
If we examine ETF holdings in both gold and silver, we note that in the period from 2007 to 2012, the increase in silver holdings amounted to 12,000 tonnes, compared to 1,200 tonnes of gold – meaning, investors purchased ten times more silver than gold.
These are only three factual data points to consider, but there are other indications that silver investment demand is way out of line with availability. Our favourite question to the bullion dealers we meet, is to ask the ratio of their dollar sales in gold versus silver. The answer is that dollar sales are equal, which means that physical silver sales relative to gold are greater than 50:1.
A recent news headline on Mineweb read, “Silver Sales to Outshine Gold in India.2” It went on to quote a bullion dealer that “investors and jewelry lovers prefer silver jewelry these days.” As the largest importer of gold in the world, it would be impossible for India to purchase an equivalent amount of silver, as it would require more than one billion ounces, essentially more than the current annual mine production.
While these last two confirmations of silver demand are anecdotal, the statistics from the US Mint, the ETFs, and our Physical Trust issues, are factual.
For the time being, the silver price is essentially set in the paper market where the daily average trade on the Comex is approximately 300 million ounces. An outrageous number when you compare it to the daily mine production of about 2 million ounces. As Bart Chilton, Commissioner of the Commodity Futures Trading Commission stated on October 26, 2010, “I believe there have been repeated attempts to influence prices in silver markets. There have been fraudulent efforts to persuade and deviously control that price. Based on what I have been told and reviewed in publicly available documents, I believe violations to the Commodity Exchange Act have taken place in the silver market and any such violation of the law in this regard should be prosecuted.”3
Which brings us back to the phrase “Follow the money.” In our view, it is almost inconceivable that investors would allocate as many dollars to silver as they would to gold, but that is what the data shows.
The silver investment market is very small. While the dollar value of gold in the world approaches $9 trillion, the value of silver in the forms of jewelry, coins, bars and silverware is estimated at around $150 billion (5 billion ounces at $30 per ounce). This is a ratio of 60:1 in dollar terms.4
How long can investors continue to buy silver at the current ratios when the availability for investment is only 3:1? We are surprised that the price of silver has remained at such a depressed level compared to gold. Historically, the price ratio between gold and silver has been 16:1, when both were currencies. Today the ratio is 55:1, so what are the numbers telling us? We believe this is one of those times when smart investors will be well rewarded to “Follow the money.”
On behalf of all of us at Sprott, I wish you safe and happy Holidays and a prosperous New Year.
P.S. – US Mint Sold Out of Silver Eagle Bullion Coins Until January 7, 2013
The Mint recently informed authorized purchasers that all remaining inventories of 2012-dated Silver Eagle bullion coins had sold out and no additional coins would be struck. Since the 2013-dated coins will not be available to order until January 7, 2013, this leaves a three week void for the Mint’s most popular bullion offering.
About Sprott Asset Managment
Sprott Asset Management LP (Sprott AM) is the successor to Sprott Asset Management Inc. which was founded in 2000, after the permanent separation from Sprott Securities that established in 1981. After establishing Sprott Asset Management Inc. in December 2001 as a separate entity, Eric divested his entire ownership of Sprott Securities to its employees. Sprott AM is a fund company dedicated to achieving superior returns for its investors over the long term. In June 2009, Sprott AM reorganized to better define and streamline the key segments of our business. Sprott Asset Management LP currently manages a number of long/short equity strategies and mutual funds. Sprott Private Wealth LP (Sprott PW) provides advisory services to high net worth individuals. Sprott Inc. is the parent company of Sprott AM and Sprott PW.
| 1 | Sources: Gold data is from World Gold Council www.gold.org, and silver data is from Silver Institute, http://www.silverinstitute.org/site/supply-demand/ |
| 2 | Source: Mineweb.com |
| 3 | Source: Bloomberg: http://mobile.bloomberg.com/news/2010-10-26/silver-market-faced-fraudulent-efforts-to-control-price-chilton-says.html |
| 4 | Sources: Gold data is from World Gold Council, silver data is from United States Geological Survey (USGS) and Silver Institute. |

Just as I was about to enjoy the last day of what has been more work than vacation time, gold gets hammered on the back of news the punch bowl may be running dry. Throw in the fact that it always seems to get assaulted around the monthly employment report and one can certainly feel like its Deja-vu.
The latest plunge started yesterday when the Fed minutes showed some members want to be able to slow or stop their purchases well before the end of 2013. Others didn’t see a need for a specific timeframe for ending what we know as “quantitative easing”
Forgetting for a moment that other governments are still stimulating their economies like Japan (will likely increase its inflation rate by increasing asset purchases while adding to fiscal stimulus) and China (which plans to increase infrastructure spending and sustain loan growth), it’s a fairytale to think the FED can actually do anything but keep its foot on the gas pedal.

Why? The United States is up the creek without a paddle. Its political process has blown up and the FED knows the inmates are now running the asylum that’s responsible for fiscal policy. Because Ben Bernanke painted the FED into the corner and has run out of paint, he and his entrapped group has sent a “Hail Mary” towards the front door of the asylum letting the inmates know the punch bowl has no more kick to it and they somehow need to pull a rabbit out of the hat and get serious on deficit and entitlement reduction policies.
If you believe the inmates will do so and the FED can and will actually drain liquidity (allowing interest rates to rise due to actual tightening) well, I not only have a bridge to sell you but would urge you to stop reading this blog immediately.
Gold has been in a trading range of $1500 – $1800. It shall be pressured for the near-term and can retest the lowest part of the range. But after a decade of overcoming an overwhelming number of anti-gold waves from the investment community and the media that follows it, I believe this is just another bump in the road that leads to a $2,000+ gold price in 2013. The fact that such a view seems as far-fetch as a rookie winning the Super Bowl this year at the start of the NFL season, I’ll remain on board the mother of all gold bull markets and hope I’m not related to Captain Edward Smith.


Resemblance?
About Peter Grandich
Grandich is the founder of Grandich.com and Grandich Publications, LLC, and is editor of The Grandich Letter which was first published in 1984. On his internationally-followed blog, he comments daily about the world’s economies and financial markets and posts his views on social and political topics. He also blogs about a variety of timely subjects of general interest and interweaves his unique brand of humor and every-man “Grandichism” expressions with his experience gained from more than 25 years in and around Wall Street. The result is an insightful and intuitive look at business, finances and the world, set in a vernacular that just about anyone can understand. In his first year, Grandich’s wildly-popular blog had more than one million views. Grandich also provides a variety of services to publicly-held corporations on a compensation basis.
Grandich’s autobiography, Confessions of a Wall Street Whiz Kid, was publiched in fall 2011.
He is the also the founder of Trinity Financial Sports & Entertainment Management Co. [www.TrinityFSEM.com], a firm with a Christian perspective which he started in 2001 with former NY Giant and two-time Super Bowl champion Lee Rouson. The firm offers services to celebrities, athletes and average folks. Peter Grandich is a member of the National Association of Christian Financial Consultants, and a long-standing member of The New York Society of Security Analysts and The Society of Quantitative Analysts.
Grandich is also very active in Christian sports ministries including the Fellowship of Christian Athletes and Athletes in Action.
He resides in New Jersey with his wife Mary and daughter Tara.
There is a high probability that the correction in the gold price that started in early October at $1797 has been completed.
All the minor waves are in place and the A and C wave portions are approximately equal at -$120 each. The chart below depicts the action on Comex via the 2 month forward chart:

…..read more HERE

Wednesday’s gap higher in stocks has many investors feeling really good about but will this rally last?
My to the point answer is “Yes” but there will be some bumps and navigating positions along the way.
Looking at the charts below you will notice how stocks are trading up over 4% in two trading sessions and several indicators and technical resistance levels are now being tested. Naturally when several resistance levels across multiple time frames, cycles and indicators we must be open to the idea that stocks could pause or pullback for a few days before continuing higher.
Here is a quick snapshot of charts I follow closely to help determine short term overbought and oversold market conditions.
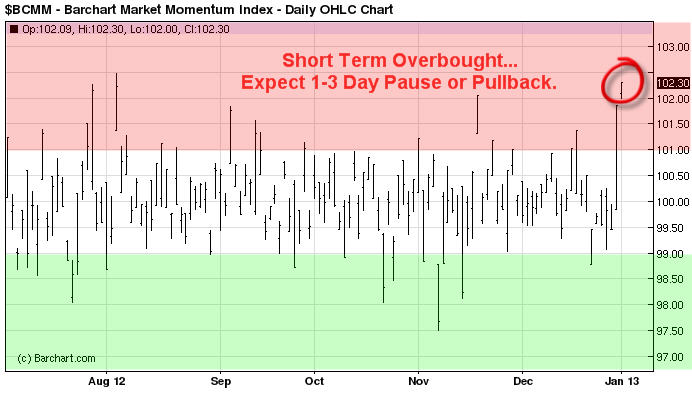
Momentum Extremes:
This chart helps me know when stocks are overbought or oversold. This trend can be follows using the 30 or 60 minute charts helping you spot short term tops and bottoms.
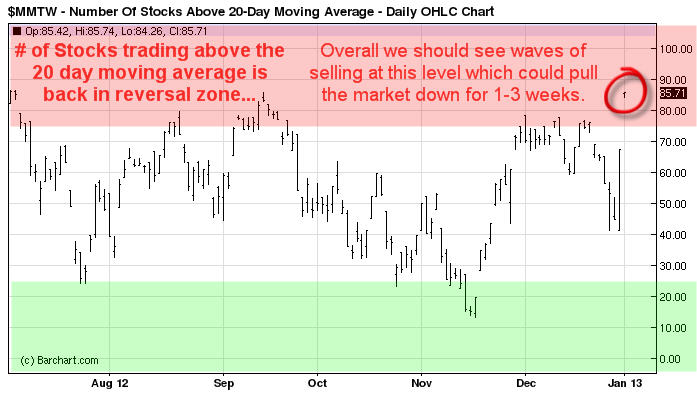
Stocks Trading Above 20 Day Moving Average:
This chart helps me time swing trades which last for 1-3 weeks in length and I use the daily chart to spot these reversals and trends.
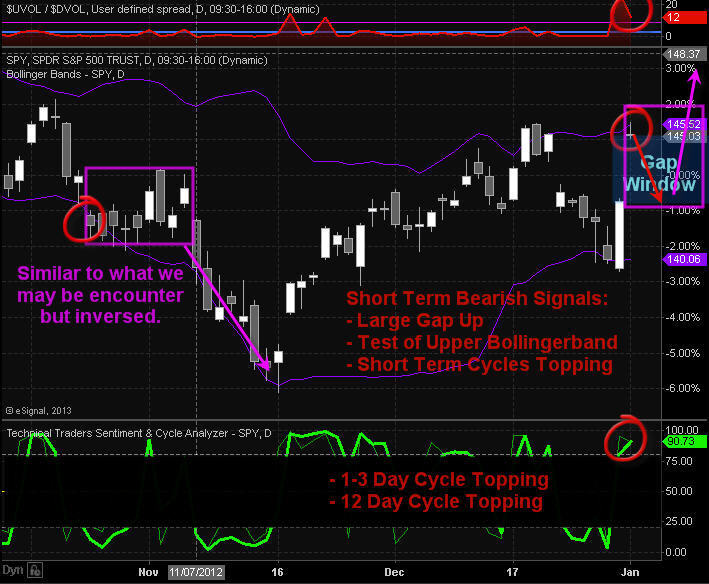
Daily SP500 Index Chart:
This chart shows the big gap in price, test of upper bollingerband, momentum and swing trading cycles topping and 12 buyers to ever one seller on the NYSE which tells me everyone is running to buy everything they can today and that is a contrarian signal.
Trading Conclusion:
This strong bounce which started on Monday from a very oversold market condition does look as though it has some power behind it. And over the next 1-3 days we could see prices grind higher until this momentum stalls out. Once that happens we should see most of the gap filled. This will provide us with a lower entry price and reduce our downside risk for index, sector and commodity ETFs.
If you are a stock trader then be sure to checkout my partners stock trading websitewww.ActiveTradingPartners.com where his last two trades Dec 31 pocketed 12.3% with gold stocks ETF NUGT, and took more profits with PRLB Jan 2nd for a 9.2% gain.
This type of bounce and momentum can lead to a running correction which makes it impossible for traders to by on a dip. A running correction is when prices slow chop higher in a narrow range for some time then explode higher continuing its rally. This is when you just need to jump in trades and chase prices higher but we will not do that until I see signs of a running correction.
Today many of the major market moving stocks are testing resistance which means if they start to get sold the broad market will pullback with them.
Follow All My Trades for 2013 – Start Today and Get 12 Months for only 6 Months: http://www.thegoldandoilguy.com/signup-newyear.php
Chris Vermeulen
Disclaimer:
I currently do not own a position in these investment but plan on buying them in the near future. This material should not be considered investment advice. Chris Vermeulen is not a registered investment advisor. Under no circumstances should any content from this website, article, video, seminar or email from Chris Vermeulen (TheGoldAndOilGuy.com) be used or interpreted as a recommendation to buy or sell any type of security or commodity contract. This material is not a solicitation for a trading approach to financial markets. Any investment decisions must in all cases be made by the reader or by his or her registered investment advisor. This information is for educational purposes only.


-
I know Mike is a very solid investor and respect his opinions very much. So if he says pay attention to this or that - I will.
~ Dale G.
-
I've started managing my own investments so view Michael's site as a one-stop shop from which to get information and perspectives.
~ Dave E.
-
Michael offers easy reading, honest, common sense information that anyone can use in a practical manner.
~ der_al.
-
A sane voice in a scrambled investment world.
~ Ed R.
Inside Edge Pro Contributors

Greg Weldon

Josef Schachter

Tyler Bollhorn

Ryan Irvine

Paul Beattie

Martin Straith

Patrick Ceresna

Mark Leibovit

James Thorne

Victor Adair