ABOUT PETER GRANDICH
Founder, Grandich Publications, LLC. and Grandich.com
home of the internationally-followed blog, The Grandich Letter
Founder, Trinity Financial Sports & Entertainment Management Co., LLC

 The “recovery” has prompted an appetite for more “productive” investments…
EVEN SEASONED travelers can make remarkably dumb mistakes, writes Daily Reckoning founder Bill Bonner.
That’s why we are writing to you from Baltimore rather than from Beijing. For the second time in a single week, we got to Dulles International Airport yesterday and discovered that we lacked the proper visa for travel to China.
You don’t always go where you intend to go, but you always end up where you ought to be. Why ought we be in Baltimore? We don’t know. But here we are.
Even seasoned investors make mistakes too. And now they seem to be selling gold. Yes, dear reader, our favorite metal is taking a beating. Gold has dropped below $1,600/oz to an intraday low of $1,555/oz yesterday. The best investors are said to be abandoning their yellow metal for more “productive” positions. From Bloomberg:
‘Billionaire investors George Soros and Louis Moore Bacon cut their stakes in exchange-traded products backed by gold last quarter as futures dropped the most in more than eight years. John Paulson maintained his holding.
‘The fourth-quarter decisions by Soros and Bacon may bolster speculation that gold’s 12-year bull run is coming to an end as economic data from the US to China show signs of recovery, curbing haven demand.
‘Soros Fund Management LLC reduced its investment in the SPDR Gold Trust, the biggest fund backed by the metal, by 55% to 600,000 shares as of Dec. 31 from three months earlier, a US Securities and Exchange Commission filing showed yesterday. Bacon’s Moore Capital Management LP sold its entire stake in the SPDR fund and lowered holdings in the Sprott Physical Gold Trust. Paulson & Co., the largest investor in SPDR, kept its stake at 21.8 million shares.’
And under the headline ‘Gold Sinks Through $1,600 on Recovery Hopes,’ the Financial Times adds:
‘Gold prices tumbled… for the first time in six months as investors turned to other assets amid hopes of an economic recovery.’
Recovery? The US, Eurozone and Japanese economies are all (according to the most recent quarterly results) shrinking, not growing. What kind of a recovery is this?
Nevertheless, mainstream opinion believes this is no time to cower in the safety of cash…or gold. Take chances. Buy stocks! Look at Buffett. He’s teamed up with a Brazilian tycoon; they’re paying $28 billion for a ketchup company.
Well, what do you think? Are they right?
Why would you ever want to hold gold, anyway? It is dumb and lifeless. It issues no upbeat press releases. It never ‘beats analysts’ estimates’. It doesn’t come out with a slick new handheld device…or announce a major acquisition.
None of the good news you hope to get from an investment ever comes from gold. No matter how much you own, it doesn’t seem to care about you; it makes no effort whatever to increase shareholder value.
Instead, it just sits there…like an old umbrella next to the front door, only useful when it rains. War? Gold goes up. Market crash? Gold goes up. Inflation? Gold goes up.
End of the world? Who knows, maybe gold would go up too.
So, you decide. What’s ahead? Good news? Or bad news? Will the 100 leading economists be right…or wrong? Fair weather…or foul?
It’s impossible to say. So, we hedge our bets. We own some real investments – stocks, bonds, real estate – and hope the 100 leading economists know what they are talking about.
And we hold on to our gold too…in case they turn out to be the numbskulls they usually are.

Mining and exploration stocks have been brutalized…..

First and foremost, I want to thank the “Silent Majority” of readers who wrote some very nice emails in the last 24 hours. It has help ease the pain considerably.
Speaking of pain, gold and mining shares have been badly beaten up and there’s no immediate relief in sight. The only positive is the bearishness has become overwhelming and if support can hold in the coming weeks, we should get a compelling contrarian situation not seen in years.


 In the second half of 2012, the media, Federal Reserve, and various Governmental economic bean counters engaged in what we call Great Global Rigging of 2012 in an effort to make the US economy look better to help the Obama campaign re-election bid.
Now that the election is over, the ugly economic realities have begun to creep out from where they were swept under the rug. And while the official economic data is bad (a negative GDP in the fourth quarter of 2012), it’s nothing compared to what real-time indicators are showing:
Wal-Mart Stores Inc. (WMT) had the worst sales start to a month in seven years as payroll-tax increases hit shoppers already battling a slow economy, according to internal e-mails obtained by Bloomberg News.
“In case you haven’t seen a sales report these days, February MTD sales are a total disaster,” Jerry Murray, Wal- Mart’s vice president of finance and logistics, said in a Feb. 12 e-mail to other executives, referring to month-to-date sales. “The worst start to a month I have seen in my ~7 years with the company.”
Wal-Mart and discounters such as Family Dollar Stores Inc (FDO). are bracing for a rise in the payroll tax to take a bigger bite from the paychecks of shoppers already dealing with elevated unemployment. The world’s largest retailer’s struggles come after executives expected a strong start to February because of the Super Bowl, milder weather and paycheck cycles, according to the minutes of a Feb. 1 officers meeting Bloomberg obtained. http://www.businessweek.com/news/2013-02-15/wal-mart-executives-sweat-slow-february-start-in-e-mails
Here’s Wal-Mart, the single largest retailer in the US, reporting that it just had the single worst start to any month in over seven years. Indeed, the company missed just revenues expectations as families adjust to a “reduced paycheck and increased gas prices.
The increased gas prices is most important. Inflation is already seeping into the system in a big way. Indeed, if you account for real inflation (not the Fed’s phony CPI measure), the US economy contracted by over 1% last quarter.
Make no mistake, we are heading into a stagflationary collapse. The time to prepare is NOW before stocks “get it.”
So if you have not already taken steps to prepare for systemic failure, you NEED to do so NOW. We’re literally at most a few months, and very likely just a few weeks from the economy taking a massive downturn, potentially taking down the financial system with them. Think I’m joking? The Fed is pumping hundreds of BILLIONS of dollars into financial system right now trying to stop this from happening.
Another Article from Phoenix Capital Research: Spain Just Issued a Warning: The System is Blowing Up Again
About Phoenix Capital Research
We are interpreters of the global economy and financial markets.
Our clients are individual investors and financial institutions seeking clear, no nonsense, insights into what’s really driving economic developments and market movements. This, combined with our unique investment ideas, has made us a research firm of choice for clients that include tens of thousands of individual investors as well as:

As the markets once again approach historic highs—the overly exuberant tone, extreme complacency and weakness in the economic data, bring to mind Bob Farrell’s 10 investment rules as applied to today’s Stock Market and sentiment Charts. These rules illuminate today’s markets and should be a staple for any long term successful investor. These rules are often quoted yet rarely heeded—just as they are now. Bob Farrell is a Wall Street veteran with over 50 years of experience in crafting his investing rules. Farrell obtained his masters degree from Columbia Business School and started as a technical analyst at Merrill Lynch in 1957. Even though Farrell studied fundamental analysis under Gramm and Dodd, he turned to technical analysis after realizing there was more to stock prices than balance sheets and income statements. Farrell became a pioneer in sentiment studies and market psychology. His 10 rules on investing stem from personal experience with dull markets, bull markets, bear markets, crashes and bubbles. In short, Farrell has seen it all and lived to tell about it.
The 10 Rules Of Investing
1. Excesses in one direction will lead to an opposite excess in the other direction.
Markets that overshoot on the upside will also overshoot on the downside, kind of like a pendulum. The further it swings to one side, the further it rebounds to the other side. This is the extension of Rule #1 as it applies to longer term market cycles (cyclical markets).
While the chart above showed prices behave on a short term basis – on a longer term basis markets also respond to Newton’s 3rd law of motion: “For every action there is an equal and opposite reaction.” The first chart shows that cyclical markets reach extremes when more than 3-standard deviations above the 50-week moving average. For the first time since the lows of the market in 2009 this has now occurred. Notice that these excesses ARE NEVER worked off by just going sideways.
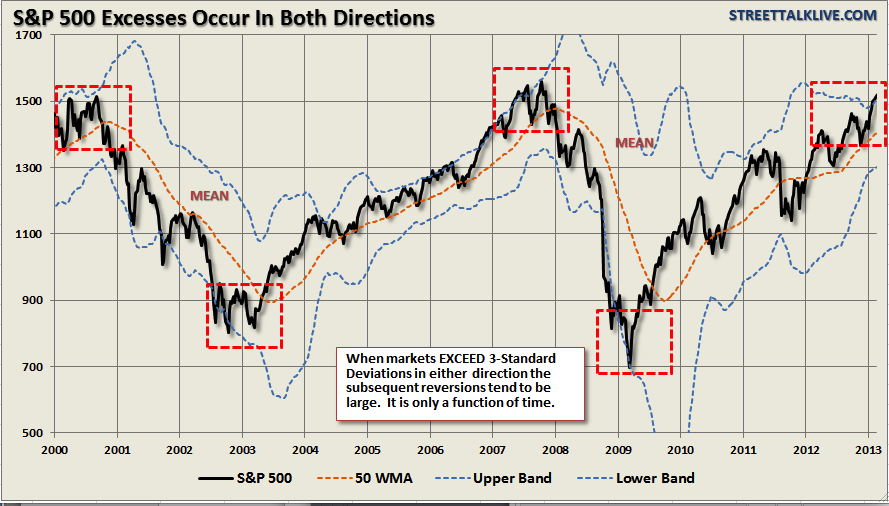
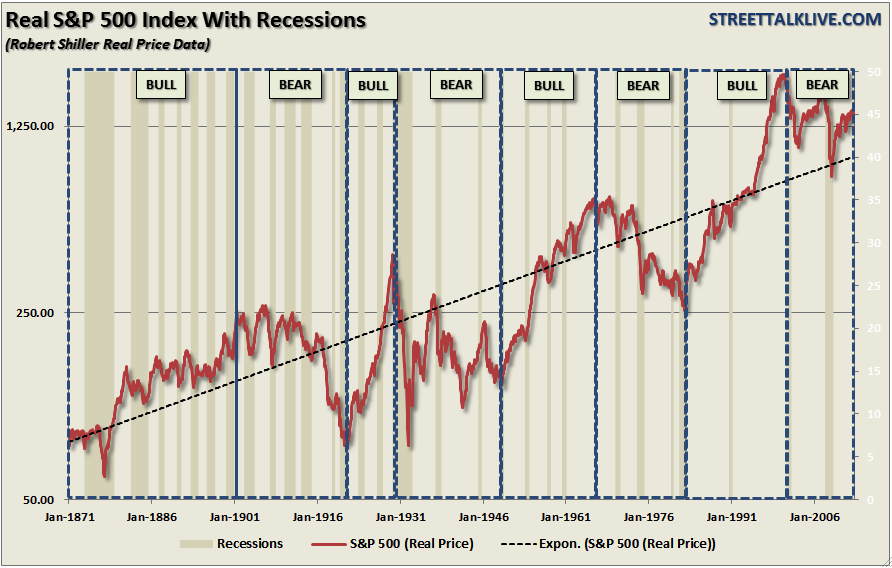
The second chart shows the price reversions of the S&P 500 on a long term basis and adjusted for inflation. Notice that when prices have historically reached extremes – the reversion in price is just as extreme. It is clear that the current reversion in the stock market is still underway from the 2000 peak.
2. Markets tend to return to the mean (average price) over time.
Like a rubber band that has been stretched too far – it must be relaxed in order to be stretched again. This is exactly the same for stock prices which are anchored to their moving averages. Trends that get overextended in one direction, or another, always return to their long-term average. Even during a strong uptrend or strong downtrend, prices often move back (revert) to a long-term moving average. The chart below shows the S&P 500 with a 52-week simple moving average.
Via Lance Roberts of Street Talk Live blog
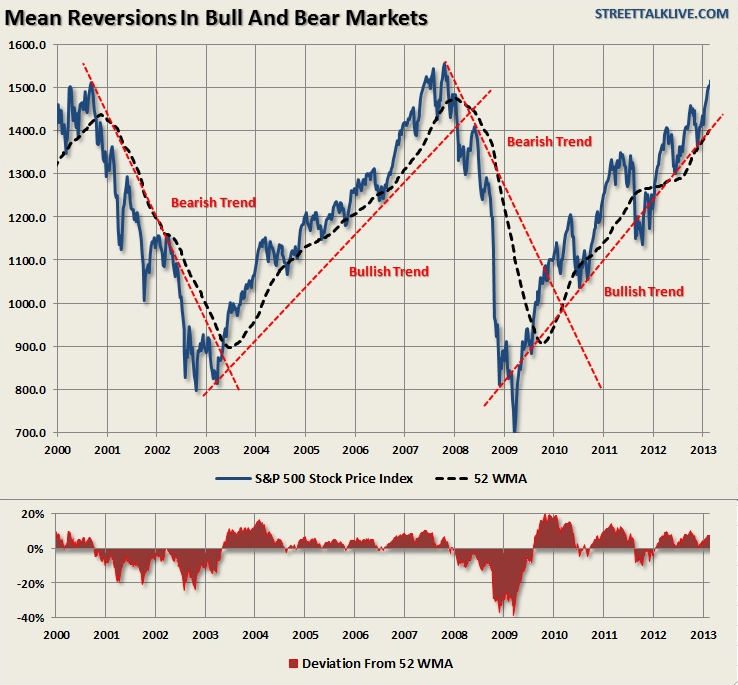
The bottom chart shows the percentage deviation of the current price of the market from the 52-week moving average. During bullish trending markets there are regular reversions to the mean which create buying opportunities. However, what is often not stated is that in order to take advantage of such buying opportunities profits should have been taken out of portfolios as deviations from the mean reached historical extremes. Conversely, in bearish trending markets, such reversions from extreme deviations should be used to sell stocks, raise cash and reduce portfolio risk rather than “panic sell” at market bottoms.
The dashed RED lines denote when the markets changed trends from positive to negative. This is the very essence of portfolio “risk” management.
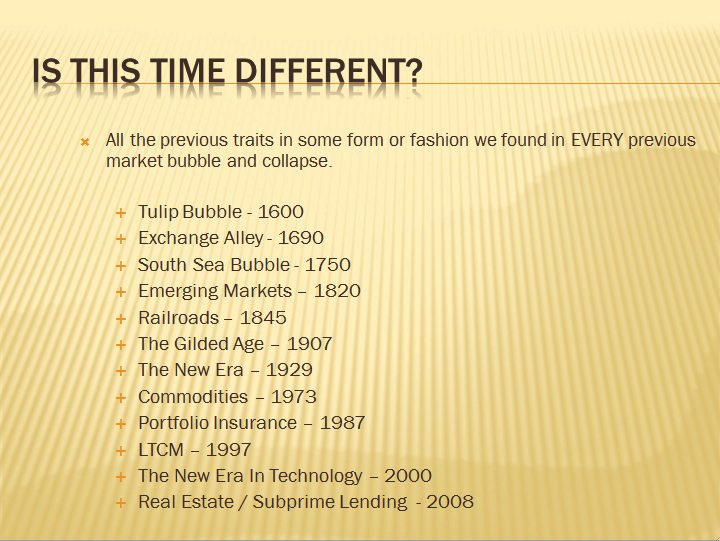
3. There are no new eras – excesses are never permanent.
There will always be some “new thing” that elicits speculative interest. These “new things”throughout history, like the “Siren’s Song,” has led many investor to their demise. In fact, over the last 500 years we have seen speculative bubbles involving everything from Tulip Bulbs to Railways, Real Estate to Technology, Emerging Markets (5 times) to Automobiles and Commodities. It is always starts the same and ends with the utterings of “This time it is different”
[The chart below is from my March 2008 seminar discussing that the next recessionary bear market was about to occur.]
As legendary investor Jesse Livermore once stated:
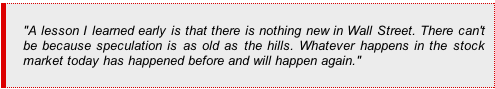
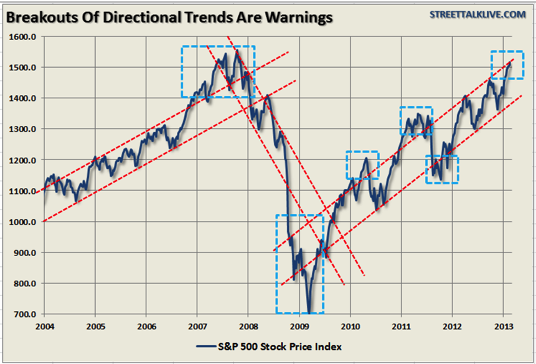
4. Exponential rapidly rising or falling markets usually go further than you think, but they do not correct by going sideways
The reality is that excesses, such as we are seeing in the market now, can indeed go much further than logic would dictate. However, these excesses, as stated above, are never worked off simply by trading sideways. Corrections are always just as brutal as the advances were exhilarating. As the chart below shows when the markets broke out of their directional trends – the corrections came soon thereafter.
5. The public buys the most at the top and the least at the bottom.
The average individual investor is most bullish at market tops and most bearish at market bottoms. This is due to investor’s emotional biases of “greed” when markets are rising and “fear” when markets are falling. Logic would dictate that the best time to invest is after a massive selloff – unfortunately this is exactly the opposite of what investors do.
The chart below shows the flow of money into equity based mutual funds.

6. Fear and greed are stronger than long-term resolve.
As stated in Rule $5 it is emotions that cloud your decisions and affect your long-term plan.
The composite index of bullish sentiment (an average of AAII and Investor’s Intelligence surveys) shows that “greed” is beginning to reach levels where markets have generally reached intermediate term peaks.
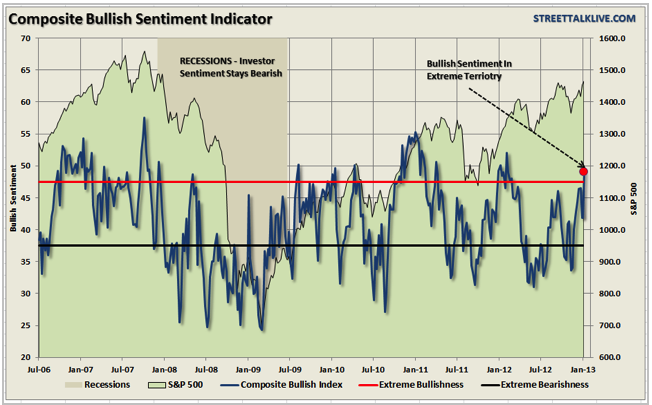
In the words of Warren Buffett:

Currently, those “people” are getting extremely greedy.
7. Markets are strongest when they are broad and weakest when they narrow to a handful of blue-chip names.
Breadth is important. A rally on narrow breadth indicates limited participation and the chances of failure are above average. The market cannot continue to rally with just a few large-caps (generals) leading the way. Small and mid-caps (troops) must also be on board to give the rally credibility. A rally that “lifts all boats” indicates far-reaching strength and increases the chances of further gains.
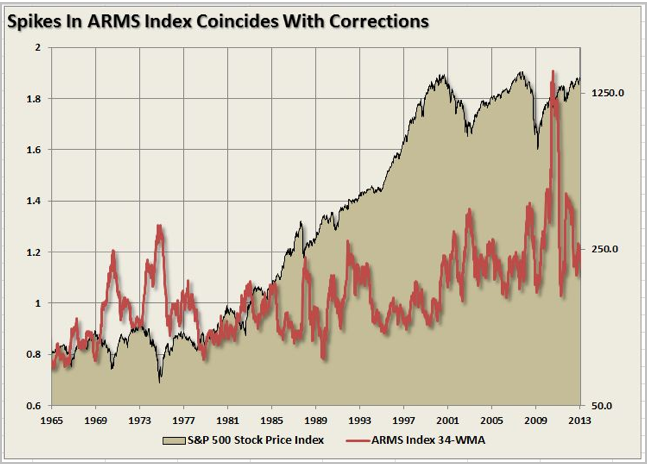
The chart above shows the ARMS Index which is a volume-based indicator that determines market strength and breadth by analyzing the relationship between advancing and declining issues and their respective volume. It is normally used as a short term trading measure of market strength. However, for longer term periods the chart shows a weekly index smoothed with a 34-week average. Spikes in the index has generally coincided with near-term market peaks.
8. Bear markets have three stages – sharp down, reflexive rebound and a drawn-out fundamental downtrend
Bear markets often start with a sharp and swift decline. After this decline, there is an oversold bounce that retraces a portion of that decline. The longer term decline then continues, at a slower and more grinding pace, as the fundamentals deteriorate. Dow Theory suggests that bear markets consists of three down legs with reflexive rebounds in between.
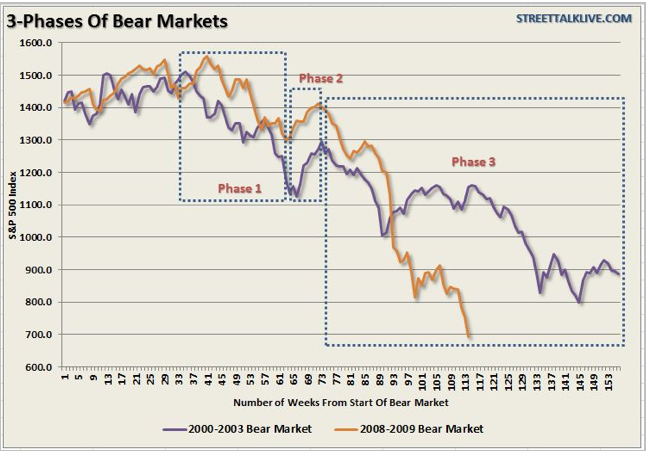
The chart above shows the stages of the last two primary cyclical bear markets. There were plenty of opportunities to sell into counter-trend rallies during the decline and reduce risk exposure.
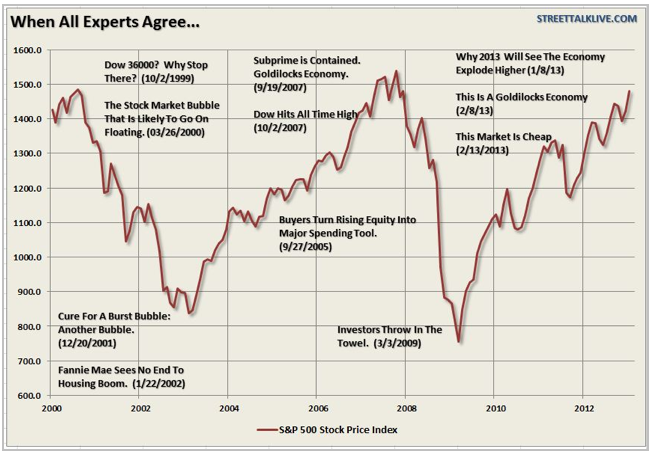
9. When all the experts and forecasts agree – something else is going to happen.
This rule fits within Bob Farrell’s contrarian nature. As Sam Stovall, the investment strategist for Standard & Poor’s once stated:

The point here is that as a contrarian investor, and along with several of the points already made within Farrell’s rule set, excesses are built by everyone being on the same side of the trade. Ultimately, when the shift in sentiment occurs – the reversion is exacerbated by the stampede going in the opposite direction
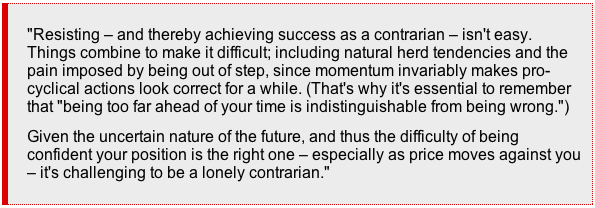
Being a contrarian can be quite difficult at times as bullishness abounds. However, it is also the secret to limiting losses and achieving long term investment success. As Howard Marks once stated:
10. Bull markets are more fun than bear markets
As stated above in Rule #5 – investors are primarily driven by emotions. As the overall markets rise – up to 90% of any individual stock’s price movement is dictated by the overall direction of the market hence the saying “a rising tide lifts all boats.”
Psychologically, as the markets rise, investors begin to believe that they are “smart”because their portfolio is going up. In reality, it is primarily more a function of “luck” rather than “intelligence” that is driving their portfolio.
Investors behave much the same way as individuals who addicted to gambling. When they are winning they believe that their success is based on their skill. However, when they began to lose, they keep gambling thinking the next “hand” will be the one that gets them back on track. Eventually – they leave the table broke.
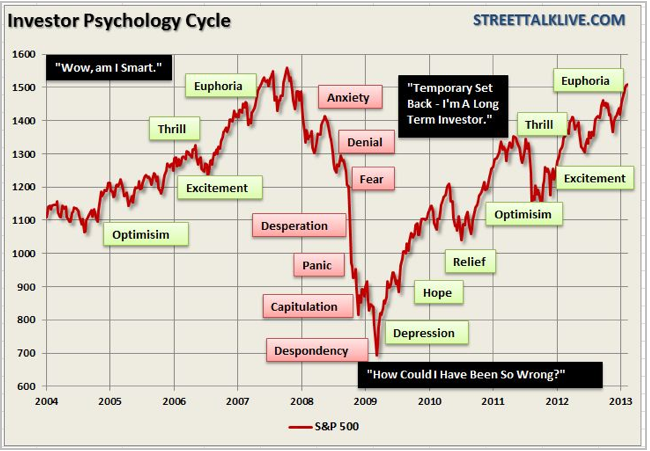
It is true that bull markets are more fun than bear markets. Bull markets elicit euphoria and feelings of psychological superiority. Bear markets bring fear, panic and depression.
What is interesting is that no matter how many times we continually repeat these “cycles” – as emotional human beings we always “hope” that somehow this “time will be different.”Unfortunately, it never is and this time won’t be either. The only questions are: when will the next bear market begin and will you be prepared for it?
Like all rules on Wall Street, Bob Farrell’s rules are not meant has hard and fast rules. There are always exceptions to every rule and while history never repeats exactly it does often “rhyme” very closely.
Nevertheless, these rules will benefit investors by helping them to look beyond the emotions and the headlines. Being aware of sentiment can prevent selling near the bottom and buying near the top, which often goes against our instincts.
Regardless of how many times I discuss these issues, quote successful investors, or warn of the dangers – the response from both individuals and investment professionals is always the same.

No you’re not. Yes, they do.
Individuals are long term investors only as long as the markets are rising. Despite endless warnings, repeated suggestions and outright recommendations – getting investors to sell, take profits and manage your portfolio risks is nearly a lost cause as long as the markets are rising. Unfortunately, by the time the fear, desperation or panic stages are reached it is far too late to act and I will only be able to say that I warned you.
About Lance Roberts (get a Free Membership HERE)
Finally, financial news that makes sense. Lance Roberts, the host of “StreetTalkLive”, has a unique ability to bring the complex world of economics, investing and personal financial wealth building to you in simple, easy and informative ways but also makes it entertaining to listen to at the same time. Lance brings fundamental, technical and economic perspectives, combined with a unique focus, to the day’s news helping listeners understand how it impacts their money.
After having been in the investing world for more than 25 years from private banking and investment management to private and venture capital; Lance has pretty much “been there and done that” at one point or another. His common sense approach has appealed to audiences for over a decade and continues to grow each and every week.
Making money is not hard. Learning how to keep it has been the trick. Lance’s teachings are fairly basic. Conservation of principal, a disciplined approach and living on less than you make and carrying little or no debt is the only way to build wealth. His advice is more of the “chicken soup” variety as there is no magic “black box” to build wealth – just time, hard work and sacrifice.
Lance is also the Chief Editor of the X-Report, a weekly subscriber based-newsletter that is distributed nationwide. The newsletter covers economic, political and market topics as they relate to the management portfolios. A daily financial blog, audio and video’s also keep members informed of the day’s events and how it impacts your money.
Lance’s investment strategies and knowledge have been featured on Fox 26, CNBC, Fox Business News and Fox News. He has been quoted by a litany of publications from the Wall Street Journal, Reuters, The Washington Post all the way to TheStreet.com as well as on several of the nation’s biggest financial blogs such as the Pragmatic Capitalist, Zero Hedge and Seeking Alpha.
After all it is “All About You And Your Money”

1987 Crash
Invest Overseas, The Fed Party Is Over
For four years the FOMC has been printing money to keep interest rates low in order to stimulate the economy. For just as long investors have been hand- variants on this form of stimulus, the “race to debase” currency has become a national phenomenon.
2013 The Year of Global Recession
A Global Recession Is Coming! Marc Faber appears on CNBC where he talks about a global recession that he see’s coming. Marc Faber is the author of the Gloom Boom and Doom report.

I know Mike is a very solid investor and respect his opinions very much. So if he says pay attention to this or that - I will.
~ Dale G.
I've started managing my own investments so view Michael's site as a one-stop shop from which to get information and perspectives.
~ Dave E.
Michael offers easy reading, honest, common sense information that anyone can use in a practical manner.
~ der_al.
A sane voice in a scrambled investment world.
~ Ed R.

Greg Weldon

Josef Schachter

Tyler Bollhorn

Ryan Irvine

Paul Beattie

Martin Straith

Patrick Ceresna

Mark Leibovit

James Thorne

Victor Adair