
Timing & trends
Gold has historically been considered a hedge for inflation, dollar devaluation and economic stress. Since the end of the last recession gold has been an asset class of choice by those expecting hyperinflation due to the ongoing activities by Central Banks worldwide. As for us , and our clients, gold is a commodity that should be owned when it is rising and sold when it isn’t. For us the best hedge against inflation is making sure that invested savings grow at a rate sufficient to maintain the purchasing power parity of those savings in the future. We can discuss the difference between inflation, hyperinflation and the effect of owning physical gold in a fiat currency world but that is another article entirely.
It seems like 18 months ago…wait, it was a 18 months ago, that we wrote in our weekly missive that gold had peaked after a parabolic spike stating:
Then in March of 2012, as the media began predicting the end of gold as an asset class, I wrote “Death of the Gold Bull Market” updating our August analysis wherein we discussed the consolidation process for gold before the next move higher could occur. Well, here we are today with gold pushing the lower bounds of that consolidation range and still entrenched in this long, and drawn out, 18-month consolidation process. So,the obvious question becomes, is it time to “buy?”
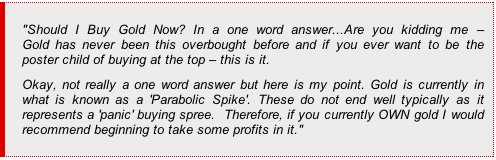
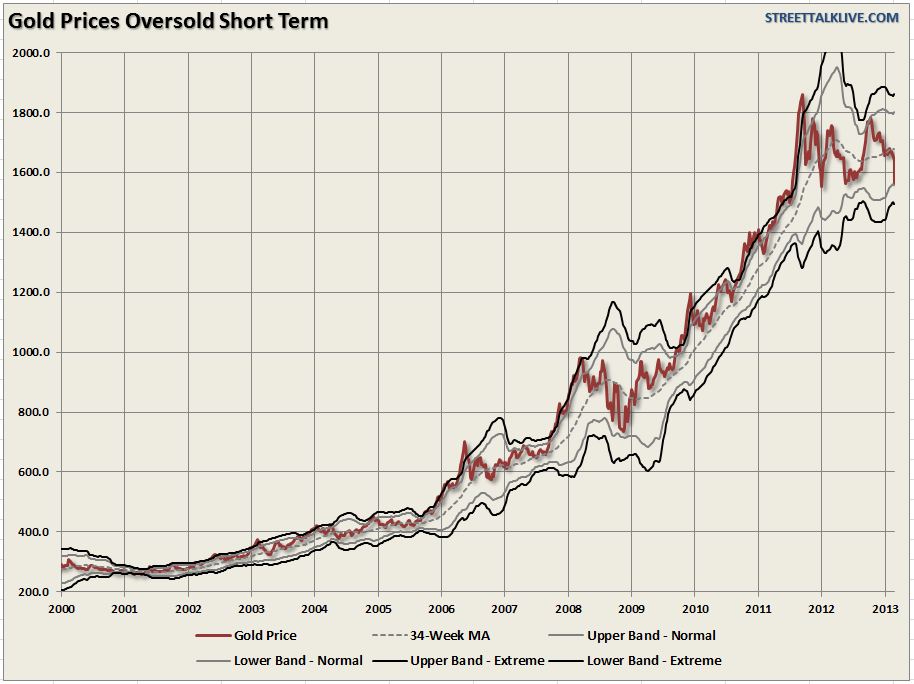
The first chart shows the weekly “buy” and “sell” signals. During the last recession gold had experienced a very similar parabolic price spike going into the first quarter of 2008. This spike in gold prices resolved itself over the remainder of the 2008 with a correction of 30% during the financial crisis. That consolidation process then gave way to the next major leg of the secular gold bull market. That surge was fueled by fears of hyperinflation due to successive rounds of liquidity injections by the Fed and soaring national debt levels.
As the Fed pondered the idea of entering into QE2 in the summer of 2011, combined with the fears of a debt default due to the “debt ceiling debate” at the time, gold again went into a parabolic price spike. While an actual default on U.S. debt was never actually a concern, as witnessed by the sharp drop in 10-year interest rates at the time, the fears of such an event sent gold prices spiraling higher (along with underground bunker, gun, ammo and dried food sales.) Currently, the fears over the debt ceiling, along with potential default on our debt, are of little concern to the financial markets. The chart shows that gold remains range bound within the confines of $1500 to $1700 per ounce.
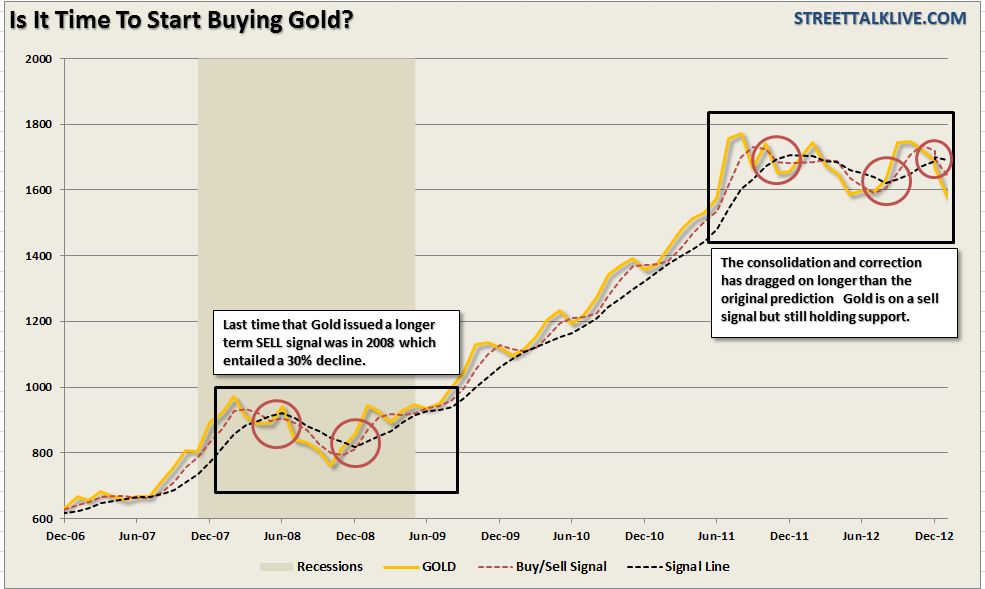
As shown in the chart below – the current “sell off” in gold has much to do with the rally in the U.S. dollar, particularly as Japan has entered into an effective “currency war” by forcing yen valuations lower. Over the past decade the movements in the dollar have had a high inverse correlation with gold.
Since gold is generally a “fear” trade it is not surprising to see gold prices under pressure given the overwhelming bullish sentiment recently about the economy and the markets. However, it is likely that such optimism will be dampened by reality as the impact of the global recession weighs on the U.S. economy as I discussed recently.
This begs the question as to what will most likely cause the next rally in gold?
Catalysts For The Next Gold Surge
The following are the catalysts that could certainly send investors scurrying back into gold.
A Resurgence In The Eurozone Crisis – It has been incredibly quite in the Eurozone since last summer when Draghi made his “do whatever is necessary speech.” However, while the crisis has seemingly been quelled there has actually been very little done to fix the issues that had previously sunk the Eurozone into its crisis. As we have discussed previously in much more detail – Germany is the lynchpin for Europe and with a large majority of the German population against further bailouts, the economy slipping into a recession and Angela Merkel up for re-election this year, it is likely that the things could potentially come to a head once again. A resurgence of the debt crisis could well fuel fears of a breakdown in the global financial system pushing gold prices higher.
Stock Market Declines By 20%
The stock market will have another correction sometime this year with my best guess being sometime this summer – if not sooner. The markets are currently extremely overbought and complacency is exceptionally high. These are the catalysts necessary for a meaningful short term correction of 10-20% just as we have seen over the past three summers. While the market has been pushing higher with the expansion of the Fed’s balance sheet, of which there is an 85% correlation, the economic underpinnings remain very weak. Therefore, any reduction in the liquidity injections, of hints from the Fed that QE programs will wind down, could send investors scurrying out the markets and into gold for a “safe haven” play.
Economy Slows To Near Recession
The fear of a recessionary economy, or worse, is a “gold bugs” best friend. There have been plenty of stories about how the economy is going to ultimately collapse and the dollar will fall to zero because of the rising debt and deficit spending of the government. While economic growth is most definitely impacted by the high debts – the “End of America” is not coming anytime soon.
However, as stated above, it is the “fear” of these events that drive individuals into buying gold as a hedge against the demise of the economy and the collapse of the U.S. currency. The economy is already running at a very weak pace and any impact from a misstep in fiscal policy, or an early withdrawal of monetary policy, could well push the economy close to, or into, a recession. In such an event gold will be viewed as a hedge against economic ruin.
Time to buy gold now?
As stated above, for us, owning gold is really more of an issue of technical analysis versus some fundamental underpinning or “emotional fear” of economic collapse. Therefore, the question of whether to buy gold now, or wait, is simply of function of what the overall market thinks about it. Prices really tell us all we need to know about a chunk of inert metal. For the gold bugs, let me clear, I am not dismissing the potential for economic crisis in the future that could send prices soaring. However, between now and that future event, there is the possibility of a large price decline that I care not to participate in.
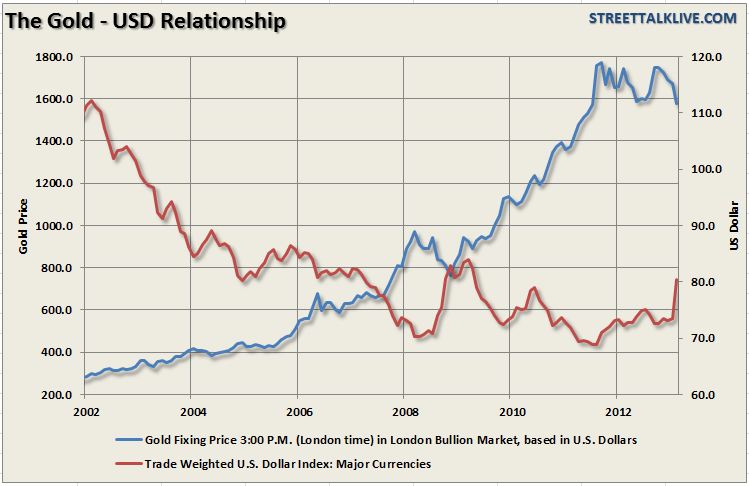
Therefore, from a technical standpoint, gold is getting to a place where a potential trading opportunity may occur. Historically speaking, when the price of gold has gotten more than 4% below the average price (inverted to display a positive number to display better) it has been consistent with a near term bottom in gold prices. With gold now 6.7% below is 13-week moving average – the risk/reward opportunity appears to be favorable for at least a short term trade. However, what investors should not be doing at this point is panic selling into this slide. With gold on a very serious “sell” signal counter-trend rallies should be used to reduce excessive weightings in gold until the overall trend becomes positive.
The second chart shows gold prices on a weekly basis going back to 2000 compared with 2- and 3-standard deviations from the 34-week moving average.

The average daily price volatility of stocks has fallen more than 60% since the beginning of 2013. It’s the biggest straight-line drop in some 82 years.
A lot of investors are rejoicing. After all, stocks have risen an average of 17% a year when volatility is as low as it is right now, Bloomberg reports.
There is, however, a dark side to low volatility. Namely, it tends to precede powerful reversals that can wipe out investors, as was the case in 2000 and early 2008, and at other key turning points over the past 100 years.

…..read the whole article HERE

The World Economic Forum (WEF), during its Davos jaunt, created an intriguing set of 50 ‘global risks’. Of course these are from the perspective of the elitest of the elite but with more than 1000 respondents, the results seem all-encompassing. The global risk that respondents rated most likely to manifest over the next 10 years is severe income disparity, while the risk rated as having the highest impact if it were to manifest is major systemic financial failure. There are also two risks appearing in the top five of both impact and likelihood – chronic fiscal imbalances and water supply crisis. The report covers five key categories of ‘risk’ – which we will be posting on in the next few days – Economic, Environmental, Societal, Geopolitical, and Technological. In this first post we expose the 50 risks by magnitude and probability, how they have evolved over the past few years, and the importance of their inter-connectivity.
Click image for very large chart. The most ‘worrying’ risks are up and to the right (higher probability and high impact)… Chronic Fiscal Imbalances tops the chart along with Sever Income Disparity.
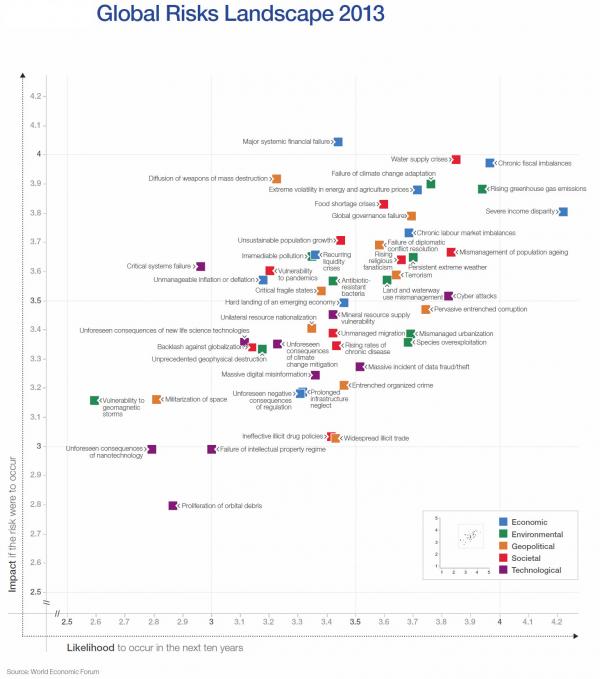
Ed Note: This article introduces 3 Risk Cases & 4 Charts, like this one posted above, which can be enlarged. Just go HERE to read and view the entire report.
NO market like a man is an island. Everything is connected and for gold to decline, ALL markets must be set up in the direction of capital flows. People always want to personalize things and attack the messenger rather than try to learn what makes the world tick.
Human emotion is always the dangerous element that MUST be minimized to achieve consistency. Hence, those who called for gold to rise to $30,000 failed to realize that cannot take place in a vacuum. Nor was it possible for the stock market to collapse when the crisis is located in the bond and debt markets. So let’s see – stocks collapse to 10 cents on the dollar because that is what they did in 1929, and to achieve that capital would have to flee to the bonds markets as a flight to quality and that means interest rates would have to go NEGATIVE?
Absolutely everything is connected. The decline in gold is part of an interlinked trend that also marked the rise in the dollar and the fall of the yen. The end of quantitative easing is the end of a lot of hype used to get gold going. The first QE program was announced by chairman Ben Bernanke in December 2008 when an ounce of gold cost only $837.50.

The Euro will crash and burn forcing the dollar even higher. Just look at this chart. The Euro initially fell to about 80 cents then rallied to $1.60. This effectively DOUBLED the international COST of all outstanding debt. This is why Greece cracked and the rest of Europe is unraveling. Politicians have wrongly used the rise in the Euro as proof they did the right thing as if it were a soccer score.
The G20 just pledged they would not engage in currency wars. They will. Quantitative easing in not just the USA, but in Japan is in effect contributing to the global trend that has impacted the currencies. Europe will see its “euro” demoralized. Politically, this will be seen by Europeans as now proof that their politicians are on the wrong road.
Ed Note: In this article HERE Martin adresses Why Cycles Work.
Austerity will give way to hold the Euro together. We will go over these interconnected trends at the Princeton World Economic Conference on March 18-19th. Now that you are starting to see the interconnections, this conference will be one of the most important events on our agenda. Sorry – I cannot guarantee there will be another in 2013. Right now, this may be the last one for the United States.

7 POTENT REASONS WHY IT’S…..
Time to Buy Precious Metals Now
Since the end of December we’ve been writing about the coming bottom in precious metals. Our forecast for 2013 was to see a low in Q1 and then continued consolidation until the end of the summer in which Gold could be in good position to break $1800. That forecast remains largely intact, although it appears the mining stocks will bottom quite a bit lower than we thought two months ago and even five months ago. Three weeks ago we noted that a potential final bottom was on the way. After beating around the bush we are ready to say that now is the time to begin buying and we’ll show you why.
Technicals
In our article three weeks ago we noted this major trendline support for the gold stocks. The market is about 6% from this major trendline which also coincides with the 62% retracement of the 2008 to 2011 cyclical bull.

Let’s zoom in on the short-term for GDX as we prefer it to the HUI above. We already know the major support trendline (for the sector) is nearby. The sector is approaching that support in an extreme oversold condition. GDX has shed 31% in the past five months and 18% in just 21 days. Moreover, note the three open gaps and how they’ve occurred following an already substantial decline. Hence, these gaps are a reflection of emotion which leads to panic. If we see a final gap then it is likely to be an exhaustion gap which would signal a reversal is imminent.

For Gold & Silver I show weekly candle charts as they give us an idea of the bigger picture. That picture is one of long consolidation after significant gains following the 2008 low. Recall the price action from 2009 to the 2011 peaks. Gold gained from $950 in the summer of 2009 to a peak of $1923 in the summer of 2011. In the same period Silver went from $13 to $49. Folks, these are massive moves that take time to be digested. By time we mean quarters to years, not weeks or months. As we sometimes try to decipher every wiggle, it’s easy to forget that point. Turning back to the present, pay attention to how the metals close this week and the next few weeks. There is major support at these levels and we expect to see the metals hold the ranges denoted on the chart.

Let’s throw in the S&P 500 for a little intermarket analysis. We have the gold stocks extremely oversold and Gold and Silver at major support while conventional equities are nearing major resistance. Which side seems to be a better buy right now? Moreover, note how each subsequent advance is getting weaker as well as shorter. Mainstream pundits like to laud this as a great bull market. The S&P rebounded 105% in the first two plus but in the 22 months since it is up only 8.8%. This is hardly a resemblance of a new secular bull market. Go look at 1942 to 1946 and 1982-1986 to see how secular bull markets actually begin. The S&P 500 has a cyclical bear market in between now and the start of the next secular bull.

Sentiment
Jason Goepfert the brilliant creator of sentimentrader.com, notes that Gold’s public opinion is at its second lowest reading in a decade. Gold has declined in price since this data was updated. Perhaps it could reach the lowest in 10 years?

Meanwhile, in other sentiment news, Dan Norcini notes that hedge fund short positions in Gold are at a 5-year high and Bloomberg noted that bets on higher Gold prices fell to the lowest since 2008.
I stumbled upon this chart which I think is from Option Strategist. It shows the weighted put-call ratio for GDX. It’s at a 27-month high.

Another from sentimentrader.com is data from the Rydex Precious Metals Fund. This is a fund focused on mining stocks. Assets in the fund have declined 50% in just the past four months! From Q1 2011 to Q2 2012, assets gradually declined. Recent action shows panic and capitulation. Relative to all sectors, this fund’s assets are inches away from reaching a minimum of a six-year low.

Conclusion
The technicals show the precious metals complex as extremely oversold and nearing strong support. This coincides with extremely negative sentiment which is bullish from a contrary perspective. Anecdotally speaking, I am amazed at the explosion of negative press in just the past few days. I can’t remember anything like it since I began following this market in 2002. Some stocks may have already bottomed while the HUI/GDX could have one nasty day left. We have begun to layer into a few positions and will continue to next week. If you have cash, now is the time to use it on both the metals and the stocks. If you’d be interested in professional guidance in uncovering the producers and explorers poised for big gains then we invite you to learn more about our service.
Good Luck!
Jordan Roy-Byrne, CMT
Jordan@TheDailyGold.com
ALSO ON THE DAILY GOLD

-
I know Mike is a very solid investor and respect his opinions very much. So if he says pay attention to this or that - I will.
~ Dale G.
-
I've started managing my own investments so view Michael's site as a one-stop shop from which to get information and perspectives.
~ Dave E.
-
Michael offers easy reading, honest, common sense information that anyone can use in a practical manner.
~ der_al.
-
A sane voice in a scrambled investment world.
~ Ed R.
Inside Edge Pro Contributors

Greg Weldon

Josef Schachter

Tyler Bollhorn

Ryan Irvine

Paul Beattie

Martin Straith

Patrick Ceresna

Mark Leibovit

James Thorne

Victor Adair