
Timing & trends
 “I don’t recall seeing anything like this since this bull market began 12 years ago” acclaimed commodity trader Dan Norcini told KWN that in the metals markets
Norcini has been stunningly accurate in his predictions of the movement of the gold and silver markets. Now the acclaimed trader discusses these incredibly important developments in both of these markets: “Hedge funds have their smallest net long position since July of 2007. But what it extremely interesting here is that hedge funds now have their largest overall outright short position in history.”
…..read more HERE


Last week in regards to Gold we wrote:
We have the majority of sentiment indicators showing more pessimism than in 2008, an explosion in negative news coverage and news that major banks have downgraded their outlooks. Without knowing anything else, you’d expect Gold to be down considerably, yet it’s only off about 5% year to date and 10% in the past three and a half months. Most important, Gold hasn’t even broken support!
Gold has failed to break below its 2011 and 2012 lows and that is a telling sign, especially in the face of this pervasive bearish sentiment. Gold looks likely to close at a four week high and we expect it to challenge $1600 in the coming days. A close below $1620 would essentially confirm that the bottom is in.
Meanwhile, the action in the mining shares has provided enough evidence that at the very least, a tradeable low is in. In recent writings we’ve noted the confluence of major support at HUI 336-337. The trendline connecting the 2000 and 2008 lows, the 62% retracement of the 2008 to 2011 cyclical bull and the 50% retracement from the 2000 low to 2011 high all coincided together very close the HUI 336-337. What was the recent low on the HUI? 337.

Next we want to turn your attention to the GDX and GDXJ ETFs. Starting with GDX we see the market formed a bullish reversal candle (hammer) last week with huge volume. In fact, the only higher weekly volume occurred at the May 2012 bottom when GDX also formed a bullish hammer.

Meanwhile, GDX’s little brother, GDXJ is showing the same reversal candle and with equally as large volume. Look for GDXJ to rally to $21 where a confluence of resistance (moving average, former support) should come into play.

It may take a few more days or another week to confirm but the gold shares are set to rebound and have their best rally since last summer. The market became extremely oversold, sentiment reached an extreme, the market tested strong support (HUI 337) and then put in a bullish hammer reversal and on huge volume. This is how bottoms form. At the least, we expect a very strong (in percentage terms) tradeable rally to go into the spring. We accumulated shares in advance of this bottom and more last week as the HUI rebounded off 337.
As always, readers are reminded that stock selection in this sector is critical to success. Due your own due diligence and you can far outperform the indices. Two criteria we’d use to begin screening companies are stocks that have held their 2012 lows and have strong working capital. If you’d be interested in professional guidance in uncovering the producers and explorers poised for big gains in the next few years then we invite you to learn more about our service.
Good Luck!
Jordan Roy-Byrne, CMT
Jordan@TheDailyGold.com
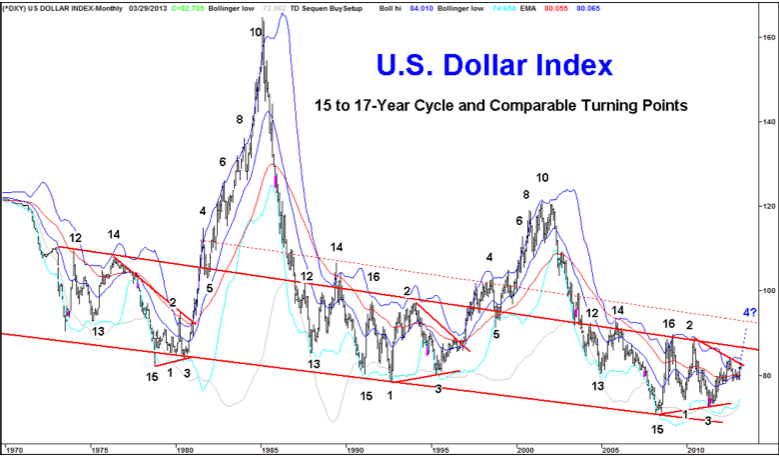
The price action in the U.S. Dollar since the 2011 bottom continues to unfold in the same manner as experienced following the bottoms of 1980 and 1995. This is within the framework of the numerous turning points in the 16-year cycle as labeled below. The February low becomes the definitive level that needs to hold in order to keep the bullish scenario in place.
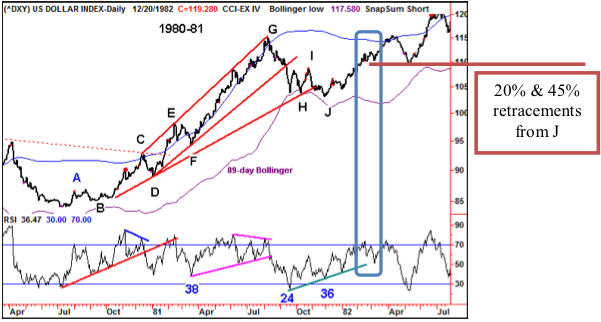
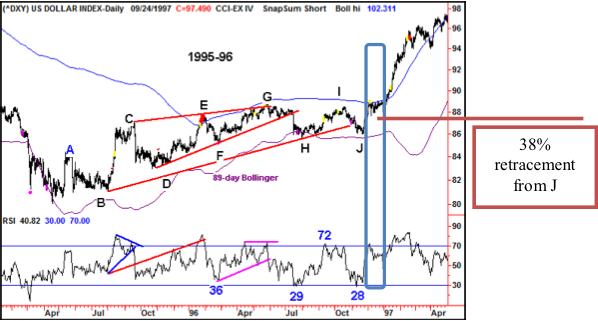
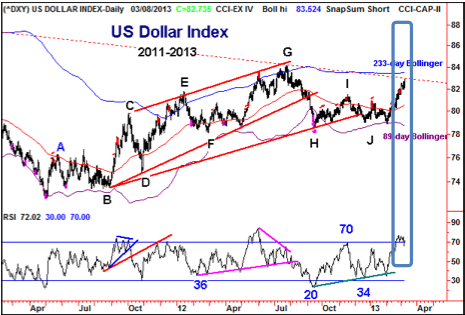
The following charts display the daily price structure. The violation of the basic support line (B to H) into point J that occurred in December is common in all three charts (). It then developed into a double bottom, successfully holding around point H (). The current rally above point I, twenty-two months after the major bottom (), should find resistance from here to the 50-week (233-day) Bollinger Band (83.55) and the July highs at 84.10.
A subsequent consolidation that gives back less than half of the rally from February 1st, allowing the RSI to drop back below the mid 50’s, could be the precursor to a longer-term breakout, targeting the dotted red resistance channel on the monthly chart around 93 (labeled point 4).
 \
\
BOB HOYE, INSTITUTIONAL ADVISORS
EMAIL bhoye.institutionaladvisors@telus.net
WEBSITE www.institutionaladvisors.com
Opinions in this report are solely those of the author. The information herein was obtained from various sources; however we do not guarantee its accuracy or completeness. This research report is prepared for general circulation and is circulated for general information only. It does not have regard to the specific investment objectives, financial situation and the particular needs regarding the appropriateness of investing in any securities or investment strategies discussed or recommended in this report and should understand that statements regarding future prospects may not be realized.
Investors should note that income from such securities, if any, may fluctuate and that each security’s price or value may rise or fall. Accordingly, investors may receive back less than originally invested. Past performance is not necessarily a guide to future performance. Neither the information nor any opinion expressed constitutes an offer to buy or sell any securities or options or futures contracts. Foreign currency rates of exchange may adversely affect the value, price or income of any security or related investment mentioned in this report. In addition, investors in securities such as ADRs, whose values are influenced by the currency of the underlying security, effectively assume currency risk. Moreover, from time to time, members of the Institutional Advisors team may be long or short positions discussed in our publications.

-
I know Mike is a very solid investor and respect his opinions very much. So if he says pay attention to this or that - I will.
~ Dale G.
-
I've started managing my own investments so view Michael's site as a one-stop shop from which to get information and perspectives.
~ Dave E.
-
Michael offers easy reading, honest, common sense information that anyone can use in a practical manner.
~ der_al.
-
A sane voice in a scrambled investment world.
~ Ed R.
Inside Edge Pro Contributors

Greg Weldon

Josef Schachter

Tyler Bollhorn

Ryan Irvine

Paul Beattie

Martin Straith

Patrick Ceresna

Mark Leibovit

James Thorne

Victor Adair