
Timing & trends
“I want to make sure I get this across. That was the Attorney General saying that banks are not only too big to fail, but they’re now too big to prosecute. Imagine if you’re sitting in one of the trading rooms at JPMorgan or Goldman Sachs and realize that the Attorney General says we’re so big they can’t go after us. It’s like a free pass. I think this means the calamity to come will be far worse than 2008.”
“I think there’s a reason playing out in front of our eyes right now. The investment community, mainly large hedge funds and those types, has decided to make a big bet that gold has peaked. There has been a tremendous amount of shorting, and we can see it from commodity weekly results that large, speculative funds have one of their largest short positions in decades. Ironically, at the same time, the bankers have the lowest short position they’ve had in quite some time. Placing that bet has pressured the gold market, along with a slew of daily, if not hourly, articles predicting the end of the gold market.”
“Here is the problem—gold is a hated investment tool. Ninety-eight percent of the people in the financial world (and most of the media that reports on them) make their living off financial assets. You’re not going to get those people to support gold because, if gold does really well, you can be almost certain there is something wrong economically and impacting those financial assets in a negative way.”
….read the 3 page interview HERE

 In Niall Ferguson’s Civilization: The West and the Rest, he presents a list of institutional arrangements that turned a bunch of ignorant, “malodorous” Europeans into the world’s dominant culture in the space of a couple of centuries. One of those institutional arrangements was property rights. That is, when something is yours it’s yours, not the king’s or the clergy’s or the local lord’s. A contract, once agreed to, is sacred before the law and is enforced by the powers-that-be.
This institution hasn’t always been perfectly respected, of course, but in the West’s more successful capitalist democracies it has been solid enough to allow citizens to work, save, create and innovate, reasonably secure in the knowledge that they’ll get to keep most of what they earn and all that they save.
The centrality of property rights is why Cyprus is sending shock waves through the global financial system.
…..read more HERE

Our title seems obvious. We all know that the US$ tends to be negatively correlated with commodity prices. This is true in the short-term but not always so over the long-term. The US$ index is currently nearing 83. It’s at the same level it was in 2007 when Gold was trading in the $600s and the CCI (currently 554) was trading near 400. The US$ index is near the same level it was at the end of 2005 when Gold was trading below $400 and the CCI was trading below 300. This tells us that the bull market in precious and hard assets goes way beyond simple US$ weakness. It is driven by long-term supply and demand dynamics as well as rampant monetary inflation from global parties and not just the USA. Throughout this bull market, key advances and turning points have originated from strength against foreign currencies and then sustained strength amid textbook US$ weakness.
First let’s take a look at Gold priced in US$ and then Gold priced against the inverse of the US$ (a foreign currency basket represented by the ETF UDN). Note that Gold/UDN is often a leading indicator for Gold in US$. Gold/UND bottomed in the summer of 2008 and made a higher low in October, when Gold bottomed. Gold/UDN broke to new highs in early 2009 while Gold didn’t break to new highs until September 2009. The same happened in early 2010 as Gold/UDN brokeout first. At present, there are no major divergences but Gold/UDN has been quite a bit stronger than Gold in recent weeks.
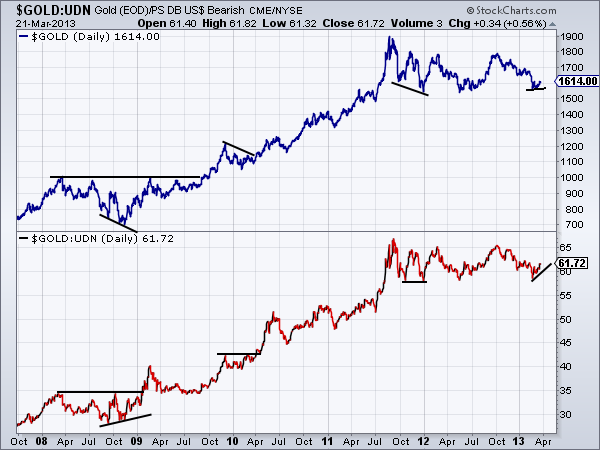
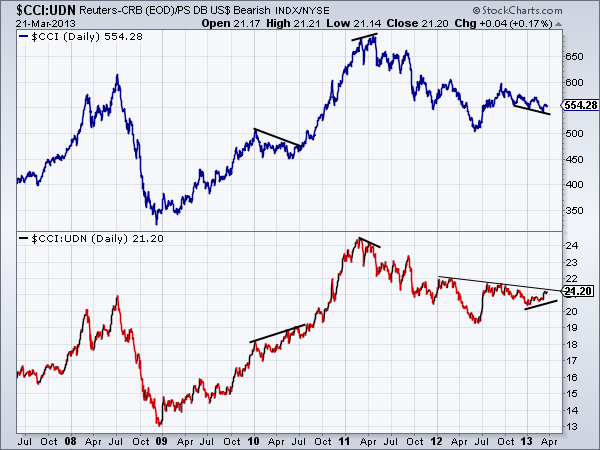
Meanwhile, we have similar observations when looking at commodities via the CCI and UDN. During 2010 CCI/UDN broke to new highs in the spring while CCI didn’t breakout until September. CCI/UDN peaked ahead of the CCI by a few months in early 2011. Currently, CCI/UDN is showing a positive divergence. A close above 22 would be quite telling as commodities would be at 18-month highs when priced against foreign currencies.
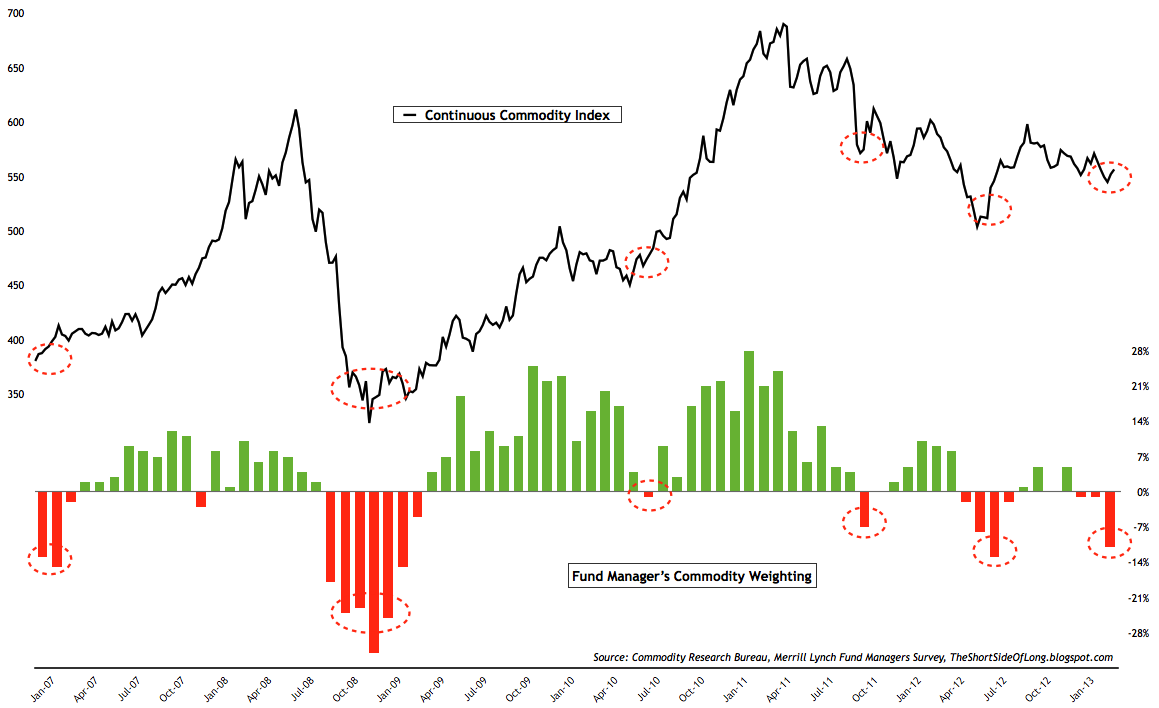
In terms of sentiment, we already know the depths of Gold and the heights of the equity market. The chart below (source) shows the CCI with the positioning of fund managers as surveyed by the monthly Bank of America Merrill Lynch fund manager survey. The current weighting of commodities (in the average fund manager portfolio) is the second lowest in four years!
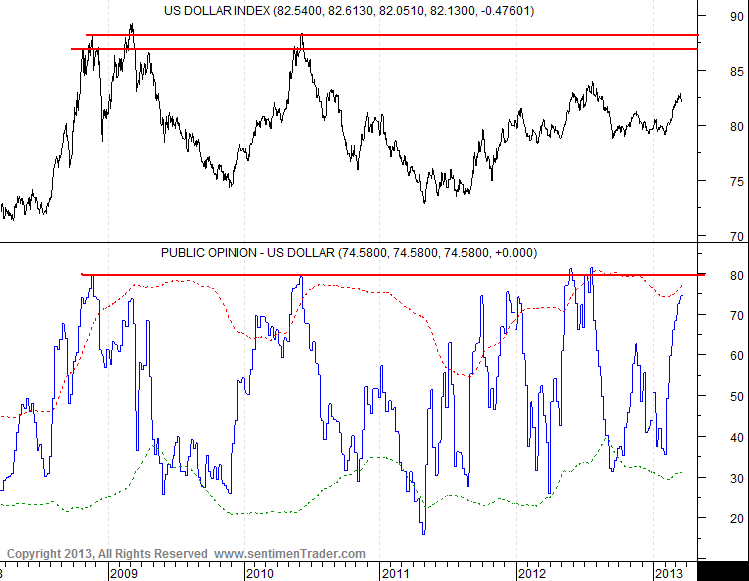
Meanwhile, as you’d expect given the skepticism on commodities, sentiment for Uncle Buck has grown more bullish. As per sentimentrader.com, public opinion is currently at 75% bulls. Peaks in the US$ have occurred with public opinion at 80% bulls. The US$ has a bit more upside until resistance at 87-88.
Moving back to our original point, the US$ plays an important role in commodity markets but is not the sole determinant of exact peaks and bottoms. In fact, the US$ is usually a lagging indicator for Gold and gold stocks as shown below. We plot the US$ inverse, Gold and the HUI. The blue line shows the important bottoms in Gold and the HUI and the red line shows the corresponding bottoms in the US$ inverse. Essentially, the precious metals market will form major bottoms ahead of tops in the US$.
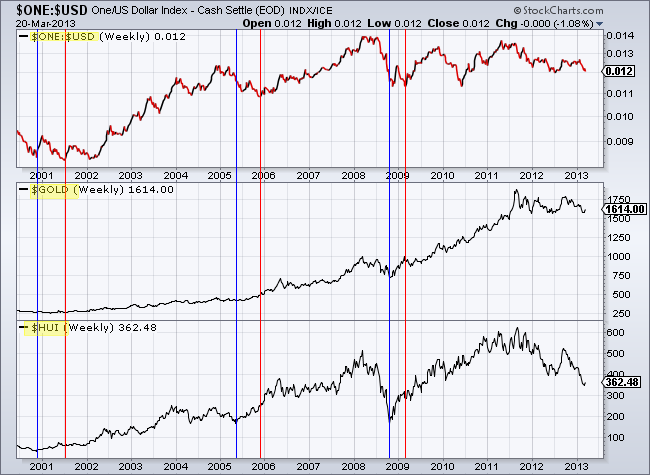
What does all this mean going forward? We believe that 2013 will mark an important transition year as the equity market is likely to make a cyclical peak while commodities make an important cyclical bottom. We already know that sentiment on commodities and precious metals is at dumpster diver type levels. Adjust for the US$ strength and it’s clear that these markets are showing some short-term strength amid poor sentiment. That is a positive sign and one we often see ahead of key turning points in these markets. However, the US$ has some more upside before its next important peak. Precious metals have found a bottom and are moving higher, but they won’t embark on their next big move until the US$ peaks. We’ve carefully added to longs in recent weeks but will remain patient in our anticipation of the next big leg higher later this year. If you’d be interested in professional guidance in uncovering the producers and explorers poised for big gains in the next few years then we invite you to learn more about our service.
Good Luck!
Jordan Roy-Byrne, CMT
INSTITUTIONAL ADVISORS
THURSDAY, MARCH 21, 2013
BOB HOYE
PUBLISHED BY INSTITUTIONAL ADVISORS
The following is part of Pivotal Events that was published for our subscribers March 14, 2013.
Signs Of The Times
 “I view the balance of risk as still calling for a highly accommodative monetary policy to support a stronger recovery.”
– Janet Yellen, the Fed’s # 2 official, Bloomberg, March 4
She added that there was no “persuasive evidence” of financial instability. Clearly, Yellen is reading too many internal reports and has never spent any time as a margin clerk.
However, on the same day, March 4th, Bloomberg reported:
“Former Fed chairman, Paul Volker, said U.S. central bank officials may find it difficult to rein in their historical stimulus at the appropriate time– ‘because there is a lot of liquor out there’.”
“Disposable income, or the money left over after taxes, plunged 4 percent, the biggest plunge since monthly records began in 1959.”
– Bloomberg, March 1
“The riskiest U.S. companies are tapping institutional investors at the fastest pace ever.”
– Bloomberg, March 1
“U.K. Manufacturing unexpectedly shrank in February as new orders plunged.”
– Bloomberg, March 1
“German factory orders unexpectedly fell in January as the sovereign debt crisis curbed demand in the euro area.”
– Bloomberg, March 7
Unexpected plunges in economic numbers provide an interesting contrast against reckless behaviour by investors and central bankers.
“Private equity firms have lost no time taking advantage of record low yields in global leveraged loan markets. And like a school of piranhas sensing blood, they have thrown themselves into the fray with gusto. The frenzy of activity comes as institutional investors…demand assets that carry a higher yield.”
– Financial Times, March 7
“Collateralized loan obligations paying the lowest rates in five years are being snapped up by investors, providing fuel that’s contributing to the biggest surge in corporate buy outs since before the financial crisis.”
– Bloomberg, March 8
Stock Markets
High sentiment and momentum readings clocked in January were followed by five weeks of consolidation. This month’s rise includes 10 consecutive trading days up for the Dow, including today. It’s a sign of enthusiasm.
Weekly RSI momentum is up to 74, which seems to be a spike. This compares to the 73 reached a couple of times with the “rounding” top of 2007. Higher readings of 76 and 78 were only accomplished on the power rallies out of the 2002 and 2009 crashes.
The sharp plunge in U.S. disposable income could be mainly due to radical policies. But “unexpected” bad numbers in England and Europe are telling a sad story that not much of their “stimulus” is going into GDP, which Janet Yellen may be focusing on. Perhaps Volker has a broader perspective on financial conditions.
While the incoming tide of “liquor” seems not to be lifting the GDP and employment boats in the harbor, it has been lifting financial instruments.
This shows up in the Broker-Dealer Index (XBD), which soared to a Daily RSI of 85 through most of the first two weeks in February. The Weekly got to 73. Both momentums reached the highest in years. And the latest rally has made it to 110 on the index, which is a big test of the 110 reached in February. Momentum then was at 65, now it’s at 73, which suggests the test will fail.
Of interest, is that in 2007 and in 2011, Broker-Dealers led the high in the S&P.
Another topping indicator is the Percent Bulls on the NYSE Composite and it is showing negative divergence.
There are now more indicators registering conditions for a reversal than in late January. We would continue to sell the rallies.
Currencies
The US dollar continues to rise against the euro, C$, yen and sterling. The DX did trade at the 82 level, but for only two days. Then, yesterday’s action accomplished an Outside Reversal, to the Upside that took it up to 83.
As noted a few weeks ago, the Daily RSI became overbought at the first of the month. As mentioned last week, the Weekly RSI is a neutral momentum, which suggested, eventually, the rise had further to go.
Obviously, the 84 level reached in last summer’s concerns about Euro debt default represents considerable resistance. In looking at the chart back to 1980 there has been a tendency to respect resistance levels. Other support levels, such as at 71.33 in 2008 (just before the stock market began its crash) and the big test at 72.70 in 2011.
Before that the big high with the Telecom Crash was at 121 in 2001-2002.
On the near-term, the dollar’s advance could pause. Rising above 84 would indicate that the karma of the marketplace is beginning to overwhelm the dogma of policymakers.
The Canadian dollar suffered its sharpest sell-off since commodities tanked in 2011. But, on this move the CRB only declined a little. The weekly RSI is down to a level that could limit the decline.
Commodities
Copper declined to 3.47 which is the support level. At 30, the Daily RSI was also at “support”. Often copper can rally into March, but the spring “seasonal” could be deferred to next month.
Much the same holds for the base metals index (GYX). A rebound seems possible. However, real copper prices have been unusually high and have yet to correct.
A recent Bloomberg report about the governing classes in egalitarian China is fascinating:
“Ninety members of the National People’s Congress are on the list of China’s 1,000 richest people.”
Beyond China’s industrial demand for copper, there has been China’s investment demand for copper. This reminds of 1996 when “Mr. Copper” in Japan had run up a huge position beyond economic demand. Herbert Black, a wealthy metals trader in Montreal, was instrumental in bringing the scam down. It cost Sumitomo $2.6 billion.
Much has been written about the uniqueness of the great change in China: The turn to industrialization, accompanied by migration from rural to cities.
Much the same happened in North America during the last half of the 1800s. Economist W.W. Rostow determined that in the late 1840s the US had 5 percent of global industrial production. By the 1880s this had increased to an impressive 29 percent. A long economic expansion segued into an era of inflation in tangible and financial assets. This ended in 1873 as a classic bubble climaxed. That marked the beginning of a Great Depression that ended in 1895. The “unique” transformation of the US economy and massive migrations from rural to urban life had little influence on that great and global contraction.
China’s “uniqueness” is in the market, but its unusual position in base metals has yet to be resolved. Mining and smelting stocks were outstanding performers into the 1873 mania. The index reached over 500 and slumped to around 20 before the depression was over.
This time around, base metal miners (SPTMN) soared from 105 in 2002 to 958 in 2007. After plunging to 177 in 2008, the index “flew” to 1600 in 1Q2011, when our Momentum Peak Forecaster kicked in. The next key low was at 781 last summer. The high in January was 1050 and last week’s low of 875 took out the November low of 895.
The present rebound could gain a little more over the next few weeks. To be wary, taking out the 781 low of last summer would be very negative to the sector. And that means the global economy!
There has been little change in agricultural prices over the past week.
Crude oil sold off to 89.33 with an RSI at 30 a couple weeks ago. The rebound has made it to 92.50. There is resistance at the 94 level.
Credit Markets
Government compulsion to buy bonds of doubtful returns continues, accompanied by complacency on the buy and hold side. All participants have a “tiger by the tail” and dare not let go. For fear of being mauled.
This has been the case with every inflation, and all have been deliberate and not accidental. But due to exhaustion, all have ended. Recently the street is again in the mode that “printing” over the past few years will suddenly erupt in a massive surge in the CPI. On March 7th a letter-writer headlined:
“Are You Prepared For Hyperinflation?”
Our point has been is that the “inflation” has been in financial assets – particularly in lower-grade bonds. And without speculator’s compulsion to get leveraged the Fed’s portion of credit creation would not happen.
Actually, inflation in financial assets has been “on” since inflation in consumer prices blew out in 1980.
More recently, Our February 14th edition reviewed the sequence of speculative highs set in different classes of bonds.
The first was in long-treasuries reaching 153 with last summer’s European crisis. Then Munis accomplished the big surge with the MUB reaching 113.5 at the end of November. The initial plunge was to 108.43 in mid-December and the rebound made it to 112.15 in January. The price traded down and up to the key high at 111.86 at the first of the month. The drop to 109.67 is significant. Taking out the 109 level would be concerning.
The next support level is at 104. Another crisis would take it down to 90.
Emerging Market Bonds (EMB) became the next favourite on the run to 122.46 at the first of the year. Today’s trade is at the 118 support level. Taking it out seems inevitable. The next level is at 105 and in the last crisis the market cleared at 60.
With some zest, Junk (JNK) is testing the momentum high set at 141. Taking out 40 turns the action down. In which case the next level is 36. In the crash it plunged to 18.
We look at this as a sequence of speculative surges and Junk is the last horse to run and it is getting tired.
On the bigger picture, our Gold/Commodities Index turned up in May 2007 a few weeks before all credit markets turned down. To the worst financial calamity since the 1930s.
It could take a few weeks to confirm the uptrend and that could be the “Death Cross” for orthodox investments in stocks, junk bonds and commodities. Not to overlook subscriptions in “hyper-inflation” letters.
Link to the March 15, 2013 ‘Bob and Phil Show’ on TalkDigitalNetwork.com:
http://talkdigitalnetwork.com/2013/03/dream-team-ii/
BOB HOYE, INSTITUTIONAL ADVISORS
E-MAIL bhoye.institutionaladvisors@telus.net
WEBSITE: www.institutionaladvisors.com

The current investment market for junior gold companies is arguably one of the worst since the United States went off the Gold Standard in 1971.
Despite the current high price of gold (and many other commodities), investors have almost abandoned the junior gold mining sector to invest in physical bullion, ETF’s, and producing companies. The value of the TSX-Venture Composite Index, shown below, is similar to what it was in the early 2000’s when the price of gold was below US$300 per ounce.
In 2013 I expect to see the equity market in the junior gold sector begin to correct itself and investors should currently be taking advantage of the investment opportunities resulting from the severely beat up junior sector. There presently exists a great opportunity for those investors who are “ahead of the herd” and want to invest in the market at or near the bottom.
TSX-V Composite Index 10 Year Chart

The Venture exchange is down over 50 percent from its March 2011 high.
The questions become – How does an investor take advantage of the dislocation in the junior markets? What might be a good junior to have on our radar screens?
 Investing in junior gold miners is a speculative business at best, with risk on the downside but the potential for significant reward on the upside.
Two ways to mitigate risk for investors is to buy at market bottoms and have a long-term view of their investments to take advantage of a company’s increasing value as its projects move through exploration and development while markets recover. Ideally, the pay off comes when a project is brought into production, gets joint ventured, or is sold by the junior.
So in this environment, companies should have the following key attributes:
- Established track record
- Experienced and competent management teams
- Established mineral resources
- Projects in safe and stable jurisdictions of the world
- Strategically located properties – existing infrastructure
- Significant upside potential
….if you are interested in a company Richard has selected according to this criterea, read more HERE

-
I know Mike is a very solid investor and respect his opinions very much. So if he says pay attention to this or that - I will.
~ Dale G.
-
I've started managing my own investments so view Michael's site as a one-stop shop from which to get information and perspectives.
~ Dave E.
-
Michael offers easy reading, honest, common sense information that anyone can use in a practical manner.
~ der_al.
-
A sane voice in a scrambled investment world.
~ Ed R.
Inside Edge Pro Contributors

Greg Weldon

Josef Schachter

Tyler Bollhorn

Ryan Irvine

Paul Beattie

Martin Straith

Patrick Ceresna

Mark Leibovit

James Thorne

Victor Adair