
Timing & trends
Produced by McIver Wealth Management Consulting Group
Mark Jasayko, CFA,MBA, Portfolio Manager with McIver Wealth Management of Richardson GMP in Vancouver.


Escape Velocity
Central bankers have gone totally mad. The stunning news of today is a new pledge by Japan to double its monetary base in two years as the Bank of Japan Unveils Aggressive Easing.
The Bank of Japan will aim to double the monetary base over two years through the aggressive purchase of long-term bonds, in a dramatic shift aimed at ridding Japan of the deflation that has dogged the country for almost two decades.
Haruhiko Kuroda on Thursday announced his arrival as central bank governor with a “new phase of monetary easing”, a move that comes after Prime Minister Shinzo Abe told the bank to target a 2 per cent rate of inflation.
“We can’t escape deflation with the incremental approach that’s been taken until now,” Mr Kuroda said after the announcement. “We need to use every means available.”
“I am confident that all the policies we need to achieve 2 per cent inflation in around two years are now in place,” he said.
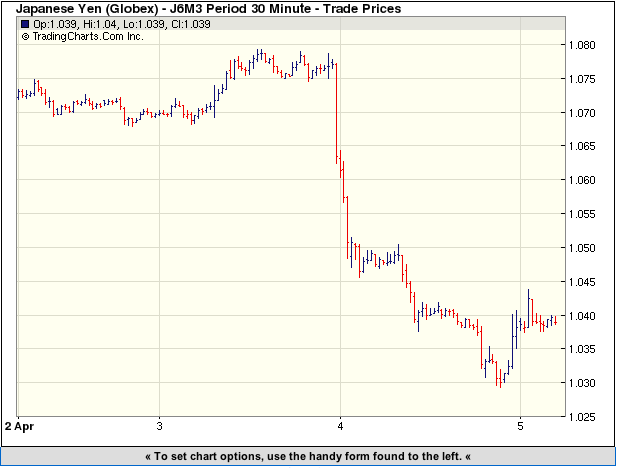
Yen Plunges
As one might expect on such a surprise announcement, the Yen had a spectacular plunge.
Draghi Signals More Easing
Bloomberg reports German Yields Fall to 8-Month Low as Draghi Signals More Easing
German government bonds rose, pushing 10-year yields to the lowest since August, after European Central Bank President Mario Draghi signaled further stimulus is possible should economic conditions deteriorate.
French and Austrian 10-year yields fell to records as Draghi said monetary policy will “remain accommodative for as long as needed” to boost growth. Spanish and Italian bonds pared gains as the ECB president said the central bank won’t immediately implement measures to ease funding strains for smaller companies.
Fed Uncertainty Principle
This is all in accordance with the Fed Uncertainty Principle corollary three.
Corollary Number Three:
Don’t expect the Fed [central banks in general] to learn from past mistakes. Instead, expect the Fed to repeat them with bigger and bigger doses of exactly what created the initial problem.
Japan is eventually going to achieve “escape velocity” on deflation, and I assure you Japanese citizens will not like the results when it happens.
When the Japanese bond market finally reacts to this inane policy, there is going to be a global currency crisis.
Mike “Mish” Shedlock
http://globaleconomicanalysis.blogspot.com

Most chartists use daily or weekly charts. Few look at monthly charts. I don’t know of anyone (myself included) who pays any attention to quarterly charts. We decided to take a look at the quarterly chart of the HUI gold bugs index. It is below and we note the two big downturns in the market. Also note the importance of 300 which has been support for the past seven years.

Some have chided your humble author for saying that the gold stocks are still in a bull market. After all, these two big downturns invalidate any assertion of a bull market. Right? Well, the previous bull market in gold stocks also included two large downturns. Within the 1960 to 1980 bull market, the first correction was 61% and lasted about two years. The next correction was 68% and also lasted about two years.
Even more intriguing is the similarities between the gold stocks over the past five years and the Nasdaq from 1987 to 1990. Both markets crashed and then quickly recovered to a new marginal high. Furthermore, note the price action in the Nasdaq during late 1989 to 1990 and compare it to the price action of the gold stocks over the past 15 months.

Like the Nasdaq, the HUI formed a bullish double bottom (A,B) and advanced quickly and strongly. Both markets then fell apart. The Nasdaq declined 31% in only a few months. That was almost as bad as the first crash! The gold stocks have declined about 40% in the last six months.

After its bottom in 1990 the Nasdaq gained nearly 16-fold over the next 10 years. Following its second massive downturn within the 1960-1980 secular bull market, the Barron’s Gold Mining Index advanced nearly 7-fold in the next six years. This is not to say that the gold stocks are likely to repeat the same pattern. This is to show that there is a strong historical precedent for the current downturn to occur in the context of a major bull market.
Ok, I know what you thinking. Jordan, why didn’t you provide this analysis weeks or months ago? The answer is, we’ve been aware of these charts and that is one of many reasons why we’ve slowly “scaled into” positions. We’ve told premium subscribers what our favorites are and how we plan to scale into and build those positions over the spring and summer months. On March 1 we wrote: As for the short-term, we began scaling into positions last week but maintain plenty of cash to be deployed (potentially) at our strong targets of HUI 336 and HUI 300.
Currently, the market remains in a bottoming process. We don’t know if Thursday’s low at 317 marked the bottom or not. Judging from the quarterly chart it looks like we could see a test of 300 or a temporary break of that level. On the other hand, Wednesday’s selloff occurred on record volume and Thursday’s reversal was quite strong. There is a chance a small head and shoulders bottom could be developing. Strong follow through on Friday would certainly raise the odds that 317 was an important low.
In any event, we are moving closer and closer to a major bottom and a large rebound in percentage terms. Weeks ago we noted the extreme pessimism in Gold was beyond the 2008 low by most metrics. Sentiment towards gold stocks is even worse. Traders and momentum players think the sector is one big joke. Mainstream funds who have the slightest interest in the sector are focusing on the metals and not the shares. I can’t recall a sector that has ever been this hated within a secular bear market. It is quite amazing. That aside, we are quite confident that the sector is days to a few weeks away from the start of a very strong rebound. Be advised that there are hundreds of mining stocks and stock selection is critical to achieving strong returns. If you’d be interested in professional guidance in uncovering the producers and explorers poised for big gains in the next few years then we invite you to learn more about our service.
Good Luck!
Jordan Roy-Byrne, CMT

In this week’s talk with National Numismatics’ Tom Cloud, he explains why the reported price of gold is not the real price.
DollarCollapse: Hi Tom. It’s been a brutal couple of weeks in precious metals. Last time we talked you said that gold could fall to $1,540. Your prediction is close to coming true today, with gold below $1,560. What are your charts saying now?
Tom Cloud: There’s serious support at $1,540, but if that doesn’t hold the next major support level is $1,380. I don’t see it going this low for a variety of reasons, but it is possible because when you have an asset that’s gone up for 12 straight years you need a pullback to shake out the weak hands.
DC: You mentioned that there are a variety of reasons that a drop into the $1,300s is unlikely. Could you give us some of them?
TC: First, China is still an aggressive buyer. It’s trying to build its gold reserves up to US levels (though who knows whether the US really has what it claims) and is a long way from that point, so presumably it would use a big correction to buy even more, which would moderate the drop.
From there the list is all over the place. Obama and Netanyahu [Israel’s Prime Minister] just met to discuss Iran’s nuclear weapons program. It’s highly unlikely that they’ll allow Iran to deploy nukes, so there could be more trouble in the Middle East soon.
The US kicked the debt ceiling thing down the road until September and now we’re just printing money with no restraint. This is functionally the same thing as raising the debt ceiling; they just didn’t call it that. You’re talking $300-$400 billion of new debt in the next five months, and historically the gold price has tracked the debt ceiling.
And finally then there’s seasonality. Historically the last four months of the year have accounted for 2/3 of each year’s profits. So the further we get into 2013 the more support precious metals prices are likely to see.
DC: What about the latest European banking crisis?
TC: Cyprus is potentially huge. The Laiki bank just announced that they’ll take 80% of their largest depositors’ money, while the Bank of Cyprus’ large depositors will lose 50%. This sends a message to people with uninsured deposits everywhere, and a large number of my calls this week have been people moving money out of banks and into precious metals because they were over the [deposit insurance] limit. But it’s not just large depositors who should worry. The FDIC only has capital equal to 5% of deposits. So if there’s a run on US banks even small depositors could see a haircut. This makes physical precious metals look relatively attractive.
DC: You’d think this would send gold through the roof…
TC: Part of the reason that it hasn’t yet is that the dollar benefits from turmoil in the eurozone banking system, and a strong dollar equals a lower gold price. But that’s not sustainable. Two of my biggest clients are exporters who say their business is off because the US goods they’re selling are getting more expensive as the dollar goes up. So a strong dollar also means a weak economy, which the government can’t accept.
DC: Is your order flow reflecting the weakness in metals prices?
TC: Just the opposite. Nobody’s selling and big customers are buying. We’re doing about 35 fewer sales per week but are selling more metal because the average order is a lot bigger. Meanwhile, premiums are rising and delays are lengthening. It takes two weeks or more to fill orders for silver maple leafs and a lot of other coins. Outside of the fall of 2008 and the spring of 1980 I’ve never seen physical supplies this tight.
DC: How can tight physical supplies co-exist with falling prices?
TC: There’s a disconnect between the paper and physical precious metals markets. The big banks control the reported price by shorting in the futures markets. But this doesn’t mean anything. The growing shortage of physical shows that there are more buyers than sellers at the artificial paper price.
For more information or to place an order, call 800-247-2812 or email Tom Cloud attgcloud@bellsouth.net. Mention DollarCollapse.com for free shipping and insurance.


-
I know Mike is a very solid investor and respect his opinions very much. So if he says pay attention to this or that - I will.
~ Dale G.
-
I've started managing my own investments so view Michael's site as a one-stop shop from which to get information and perspectives.
~ Dave E.
-
Michael offers easy reading, honest, common sense information that anyone can use in a practical manner.
~ der_al.
-
A sane voice in a scrambled investment world.
~ Ed R.
Inside Edge Pro Contributors

Greg Weldon

Josef Schachter

Tyler Bollhorn

Ryan Irvine

Paul Beattie

Martin Straith

Patrick Ceresna

Mark Leibovit

James Thorne

Victor Adair