
Personal Finance
 3:03 PM An explosion near the finish line of the Boston Marathon shakes stocks up further, the S&P 500 (SPY) dipping to a new session low, -1.8%.
Police: 2 dead, 22 injured in Boston Marathon explosions
SPY price at time of publication: $156.12. Check SPY price now »
Focus Articles on SPY
- Stop Sitting On The Sidelines by Zoomie Brokers
- S&P 500’s P/E Rises To 16.4x As Q1 Results Start Coming In by Pendulum
- Something’s Gotta Give by Michael A. Gayed
Related Articles on SPY
- Gold: Correction Or Bubble Bust? by Damir Tokic
- All Eyes Off Cyprus – Where Next? by Armando Izaguirre
- Don’t Get Caught Up In Panic Selling And Capitulation In Precious Metals by Jeb Handwerger

After watching all the gains of the last 5 years get wiped out and lose more money on paper and in actual losses than I could have ever imagined to have had not that many years ago, I still am keeping an old Mark Twain saying that I failed to do in the first half of my career – “If you always tell the truth you don’t have to remember what you said”.
First let me start by saying eating this

taste better than eating this.

Having been on the right side for well over a decade and even sidestepping previous major corrections, yours truly didn’t see this plunge in gold and silver coming. To those that have (and while apologetic be advised its not to those who have been bearish all the way up as they’re little more than broken clock forecasters who like a clock are right just twice a day) correctly forecasted this sell-off, congratulations.
In a world where “what have you done for me lately” has become a way not just on Wall Street but in life itself, the only question is where do we go from here?
In the very near-term (like hours to a few days) I’ve no idea. One thing when markets plunge like this, they mimic earthquakes. Even if there aren’t any more quakes, plenty of aftershocks are possible. Knowing how the financial services industry and much of the financial media that follows it has a negative slant against gold no matter what; I fully expect a wave of bearish forecasts and chest pounding bears to be front and center until further notice.
The gut check one must do is to first remember a golden rule – the ultimate crime in investing is not being wrong but staying wrong. Has what led a decade-long run in gold faltered?
I’ve said for years that there have been four primary factors to the great bull run:
- Central Banks, once dominant sellers became neutral or net buyers (thereby removing the single largest negative that existed for years).
- Gold producers, who once literally cut their noses to spite their faces by selling production forward, have up until now made significant hedging a thing of the past.
- The world has been on a race to debase paper currencies, printing piles of new paper money while piling up debt to unsustainable levels and this has allowed gold to become an alternative to paper (funny) money.
- The creation of ETFs allowed an enormous amount of institutional money to become buyers that otherwise most likely would not have sought exposure to gold otherwise.
So let’s see if the crime is staying wrong:
- The Cyprus threat (that a former Goldman Sachs Managing Director and now President of the European Central Bank conveniently mentioned right after his former employee issue a major sell and short gold commentary) is the only potential central bank sale known at this time and its really small potatoes in the bigger picture. I fully expect a few months from now we will learn that certain Central Banks were in fact major buyers during this swoon.
- I haven’t notice or heard discussed any significant increase in hedging and believe any producer who does will not be looked on fondly by its shareholders.
- Guess what? The Japanese QE only made the race to debase, to print oodles of new paper money and add to the pile of already too much debt, more of a bullish factor.
- The ETF scenario is the only one that may have been impacted as its seeing large scale liquidation but will turn a negative only if that keeps up even when the paper market rallies.
The hardest part of the puzzle has been up until to now, the huge difference in the paper versus the physical market for gold and silver. Look, when we had the gas crisis in the 70s and afterwards, the used car market saw a flood of gas guzzlers sold onto the market. When the real estate market blew up, inventory of homes for sale went through the roof. Yet, despite the severe sell-off in the paper market of gold and silver, companies and people who buy and sell physical gold and silver continue to report extreme shortages of available physical gold and silver. If you asked yourself this, I can only shake my head as well.
Bottomline – It won’t be quick and pain and anguish will still be around but when it comes to gold, just know this.

Marc Faber of the Gloom Boom Doom Report was interviewed by Bloomberg on Friday, and of course topic number one was the brutal takedown of gold. Not all that surprisingly, he likes the resulting buying opportunity and expects “a major low in gold within the next two weeks.”
More interesting from a theoretical/historical point of view was his segue from gold to the state of the global economy:
“Today we have commodities breaking down including gold and we have bonds rallying very strongly. If you just stand aside and just look at these two events they would suggest that there are strongly deflationary pressures in the system.”
The following chart illustrates Faber’s point. Gold is the downward-trending blue line and long-term Treasury bonds are the upward-trending green line; bonds up, gold down is clearly a deflationary picture:

…..read more HERE
 After a restless night, I awake to find gold and silver getting hammered again. While I suspect I won’t be alone in wanting to do this through much of today, I must remind myself that the alternative isn’t a great choice (no matter what some emails say-lol)

There were a lot of good articles over the weekend, but I suspect they will mean little to most for much of the day. I’m going to post them anyway because I think they have some useful insight and doesn’t misery love company anyway?
Currently under $1,400, where we close today and most importantly at weeks-end, is what’s really going to matter.
- How the gold market was crashed
- 400 tonnes cruch gold
- GLD holdings plunge
- Gold and silver buyers outpace sellers by 50 to 1
- Expect margin calls Monday morning
- Assault on gold
- Historical perspective of a silver correction

Other than selected sectors (Utilities, Consumer Staples, Consumer Discretionary, Health Care), U.S. equities and most equity markets outside of the U.S. have passed an intermediate peak. Taking profits in seasonal trades expiring near mid-April makes sense.
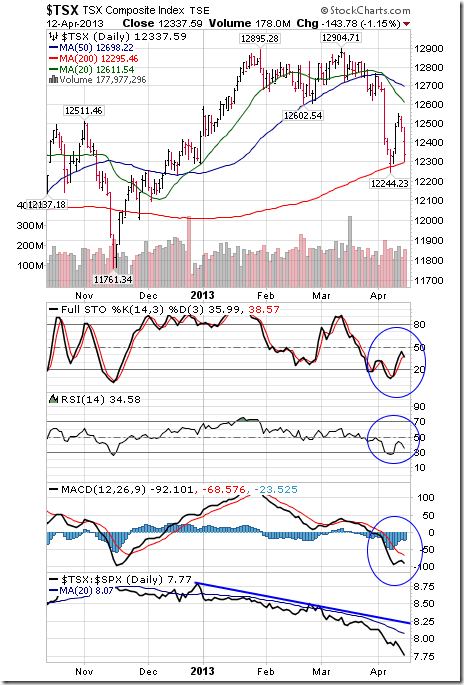
The TSX Composite Index added 5.74 points (0.05%) last week. Trend remains down. The Index remains below its 20 and 50 day moving averages. Strength relative to the S&P 500 Index remains negative. Technical score based on the above data remains 0.0. Short term momentum indicators are oversold.
…..view 47 other charts & analysis HERE

-
I know Mike is a very solid investor and respect his opinions very much. So if he says pay attention to this or that - I will.
~ Dale G.
-
I've started managing my own investments so view Michael's site as a one-stop shop from which to get information and perspectives.
~ Dave E.
-
Michael offers easy reading, honest, common sense information that anyone can use in a practical manner.
~ der_al.
-
A sane voice in a scrambled investment world.
~ Ed R.
Inside Edge Pro Contributors

Greg Weldon

Josef Schachter

Tyler Bollhorn

Ryan Irvine

Paul Beattie

Martin Straith

Patrick Ceresna

Mark Leibovit

James Thorne

Victor Adair