
Bonds & Interest Rates
 “If I had to bet on one thing in economics, my bet would be that the American Standard of Living is heading down and it is accelerating to the downside.” – Richard Russell April 12th/2013
…..read it all HERE

On October 20, 1987, I was just 31 years old and in the brokerage business a whopping three years. I was working for a NYSE member form at the time and had just been promoted to Head of Investment Strategy a few months earlier. Back in August, I had written to our clients and in my newsletter that I envisioned a stock market crash. By October 19th, one had occurred.
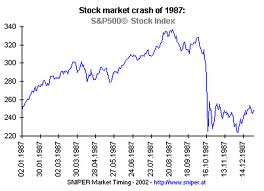 I remember walking into our office in Eatontown NJ very early the morning of the 20th. The mood was grim and fear of a further meltdown was widespread. For whatever reason(s), I decided to state that the worse was over and we could see a new, all-time high within a couple of years. I still recall the universal disbelief that such a feat could take place given what had just occurred.
Nothing has come close to that dismal feeling of hopelessness for a market in all the market swoons since then until yesterday. Total despair regarding mining and exploration stocks is widespread. This group had already been in a horrific bear market before gold and silver crater late last week and yesterday.
While I’ve 26 years more experience and at least 40lbs more body weight, I feel the same towards mining and exploration stocks as I did the market in general back on October 20, 1987. I just can’t conceive them going extinct as the prices and mood in that sector seems to be doing today. It’s total speculation (and remember Wall Street created the word speculation so it didn’t have to say gambling, but speculation and gambling are the same and one must be financially and mentally prepared to lose part or all of their capital), but the time has come to scream out to the overwhelming bearish conditions in this sector this.
You can literally throw a dart at most producers and many of the juniors (including Grandich Publication clients). Unfortunately for me, I’m out of darts (cash). For those that aren’t, I don’t think there can prove to be a better speculating opportunity in the last 30 years than right now! The fact that 99.9% will either disagree or unable to bring themselves to act, is the nail in the coffin. If I’m wrong, trust me, it will be my coffin being nailed.

In case you haven’t noticed, I’ve been on a bit of a “data doesn’t lie” kick lately…
Yesterday, I employed over two decades’ worth of numbers to debunk the negative implications regarding a plunge in bullish sentiment.
On Friday, I used stats to put the sudden spike in Japanese government bond yields into perspective. (In case you missed it, there’s no reason to panic.)
And, of course, I also recently shared undeniable numerical proof that stocks are notoverdue for a pullback.
Today, I’m staying on my data kick and setting my sights on real estate.
Recall, in April 2012, I shared 11 irrefutable signs that the real estate market had officially entered recovery mode.
Let’s see what the data tells us this year…
Nothing to Fear
There’s no denying that homebuilding stocks have been on a tear lately.
Heck, the iShares Dow Jones US Home Construction Fund (ITB) is up 62% in the last year, compared to about 15% for the S&P 500 Index.
Such an impressive run-up is making even faithful Wall Street Daily readers afraid that another housing bubble is forming.
It’s tough to blame them, considering that there are plenty of stats flying around to embolden such fears. Like the fact that searches for “home values” and “real estate listings” in the last year are up 158% and 256%, respectively, according to Yahoo! (YHOO).
But come on, people! Let’s not put our faith – or worse, our investment dollars – in consumer internet search habits. Instead, stick to the hard data coming out of the real estate market itself.
When we do, it’s clear that we’re nowhere near bubble territory.
Don’t believe me? Then chew on these five stats…
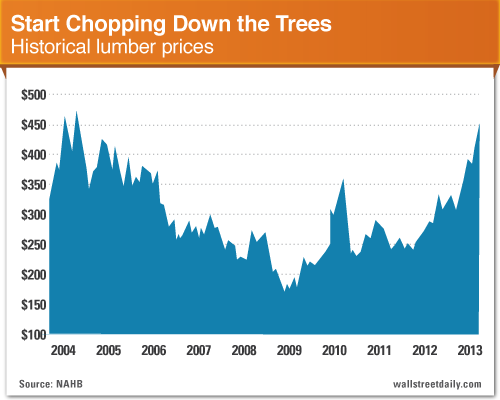
~Real Estate Recovery Stat #1: Timmmmmmber!
Don’t look now, but framing lumber prices just hit an eight-year high.
What gives? It’s just simple supply and demand. That is, supply is down and demand is up.
If the housing recovery were nothing more than smoke and mirrors, lumber prices wouldn’t be jumping.
Oh, and foreign suppliers wouldn’t be ramping up production “to meet higher demand for lumber,” either, as industry researcher Wood Resources International, LLC reports.
….read all 1-5 HERE
Why hasn’t the GOLD PRICE Held Up? – Marc Faber On Bloomberg
 Local gold stocks are taking a big hit this morning after the price for the precious metal fell into bear market territory in offshore trade on Friday, sinking to its lowest level since August last year. This outlook is even direr for gold. The plunge in the gold price has pushed the ASX’s gold stocks sub-index down 7.7 per cent in early trade.
The precious metal was trading at $US1493.45 this morning, down 4.2 per cent from local trade on Friday. US investment bank Goldman Sachs put a ”sell” on the metal last week, which sparked an early sell-off. But IG strategist Evan Lucas said it had come under even more pressure from technical selling, as it broke through the $US1522 support level to fall to $US1483. ”The bears roared even harder towards the end of last week as soft data led to analysts making the call that a period of deflation is on the cards, as the US stimulus package floods the market, but is not followed by any discernible changes to the economy,” he said. ”This outlook is even direr for gold.” Thomas Averill at Rochford Capital said gold had also fallen on the back of concerns that America and other G20 countries would criticise Japan at the upcoming G20 meeting over monetary policies that have weakened the yen and as a result, gold. ”I think you’ll see the Japanese reassure world leaders that their new monetary policy is not designed to deliberately weaken the yen,” he said. Mr Averill said it was only a short-term problem for gold, which would pick up later in the week. ”I would say that gold shouldn’t lose much more,” he said. ”The G20 meeting is a bit of a distraction, but after this week, we are predicting a resumption of the yen trade, which supports the gold price.” Burrell Stockbroking adviser Jamie Elgar said the recent rally on stock markets – Wall Street posted record highs last week – had also dampened demand for gold. ”I think gold started to come off over the last couple of months as people started becoming more confident in equities,” Mr Elgar said. ”Particularly as the economic data out of China and the US was looking pretty good.” Shares in Australia’s biggest listed gold company, Newcrest, fell 7.5 per cent this morning to $18.26. Here’s how some of the other local gold miners are performing: Kingsgate Consolidated: Down more than 12 per cent Alacer Gold: Down more than 15 per cent Precious metals investors can’t look back at this week’s declines in gold and silver and not be a little upset. But it’s important to keep in mind that nothing happened this week that reversed the decade long bullish trends for gold and silver. So, keep in mind that for over a decade gold and silver have gone up for a reason; the mismanagement of the world’s monetary system by the global central banks. That plus all financial assets today have huge counter-party risk thanks to the fraud plagued OTC derivatives market, whose notional value is in the hundreds of trillions. Physical gold and silver have no counter-party risks for their owners, and this makes them especially attractive to forward thinking investors. This lack of counterparty risk also makes the old monetary metals objects of ridicule by the global financial industry, who market fraudulent “financial assets” by the trillions of dollars, euros and other currencies. Are there any indications that central bankers have seen the error of their ways at the end of this week? Good grief no! The Bank of Japan has reaffirmed its commitment to destroy the yen as an economic asset, and the ECB is scheming to confiscate Cypress’s “excess gold reserves”. Our Doctor Bernanke is no monetary slouch either. Look at the post credit crisis Federal Reserve’s balance sheet in the chart below. Since 2008 the supply of newly created digital dollars has exploded. If US Currency in Circulation (CinC / Green Plot) lags behind the growth in digital dollars (Blue and Red Plots), it is most likely because the Earth doesn’t grow enough cotton to supply both the world’s textile mills and the US Treasury’s need for high-grade cotton based paper for its paper money production. That’s a scary thought that just might be true!
Marc Faber : Gold Decline is a Buying Opportunity

-
I know Mike is a very solid investor and respect his opinions very much. So if he says pay attention to this or that - I will.
~ Dale G.
-
I've started managing my own investments so view Michael's site as a one-stop shop from which to get information and perspectives.
~ Dave E.
-
Michael offers easy reading, honest, common sense information that anyone can use in a practical manner.
~ der_al.
-
A sane voice in a scrambled investment world.
~ Ed R.
Inside Edge Pro Contributors

Greg Weldon

Josef Schachter

Tyler Bollhorn

Ryan Irvine

Paul Beattie

Martin Straith

Patrick Ceresna

Mark Leibovit

James Thorne

Victor Adair