Personal Finance

Median US Single Family Home Price Divided by Gold

For some perspective on the single-family home market, today’s chart presents the median single-family home price divided by the price of one ounce of gold. This results in the home / gold ratio or the cost of the median single-family home in ounces of gold. For example, it currently takes a relatively low 116 ounces of gold to buy the median single-family home. This is dramatically less than the 601 ounces it took back in 2001. When priced in gold, the median single-family home is down 74% from its 2001 peak. Since making new 32 year lows last year, home prices (priced in that other global currency — gold) have worked their way higher. In fact, the median single-family home priced in gold has just broken above its eight-year, downward sloping trend channel.

Notes:
Does the real estate rally continue? The answer may surprise you. Find out now with the exclusive & highly regarded charts of Chart of the Day Plus.

20130501

Quote of the Day
“There is nothing permanent except change.” – Heraclitus

Events of the Day
May 01, 2013 – May Day
May 04, 2013 – Kentucky Derby
May 05, 2013 – Cinco de Mayo (Mexico)
May 07, 2013 – National Teacher Day
May 12, 2013 – Mother’s Day

Stocks of the Day
— Find out which stocks investors are focused on with the most active stocks today.
— Which stocks are making big money? Find out with the biggest stock gainers today.
— What are the largest companies? Find out with the largest companies by market cap.
— Which stocks are the biggest dividend payers? Find out with the highest dividend paying stocks.
— You can also quickly review the performance, dividend yield and market capitalization for each of the Dow Jones Industrial Average Companies as well as for each of the S&P 500 Companies.

Mailing List Info
Chart of the Day is FREE to anyone who subscribes.
To ensure email delivery of Chart of the Day, add mailinglist@chartoftheday.com to your whitelist.

— To subscribe, enter your email address HERE
— To unsubscribe, simply fill in our unsubscribe form.
— To change your email address, first subscribe with your new email address and then unsubscribe your old email address (as described above).


Chart of the Day is provided to subscribers without warranty of any kind and accepts no responsibility for its accuracy or for any consequences of its use.


Financial Treachery & Harsh Consequences

However, treachery with permitted bank and bond fraud, rigged financial markets, naked short ambushes, flash crashes, and lawsuits that convert criminal procedures into standard low business costs all have resulted in profound consequences. ..

…..continue reading article HERE or click on image:

4-30gj

…..read more HERE

Good morning. Here’s what you need to know.

  • Markets in Asia were mixed in overnight trading. The Japanese Nikkei fell 0.4% while the Shanghai Composite retreated 1.0%. European markets are mostly lower except for Germany and London, which are both currently up around 0.5%. In the United States, futures point to a positive open.
  • China’s official manufacturing PMI fell to 50.6 in Aprilfrom 50.9 in March, below economists’ expectations fro a drop to 50.7. Any PMI reading above 50 signals expansion, so the 50.6 reading indicates that Chinese manufacturing is still expanding, but the pace of growth is slowing.
  • South Korean exports seemed to confirm the theme,posting only 0.4% year-over-year growth in Aprilversus economists’ consensus prediction for a 2.0% advance. South Korean exports are referred to as the “economic canary in the coal mine” due to the country’s close trade relationship with China.
  • In the U.K., manufacturing PMI unexpectedly rose to 49.8 in April from 48.6 in March, beating estimates for a tick down to 48.5. The 49.8 reading is below 50, which means the U.K. manufacturing sector still contracted in April, but much less than it did in March. 
  • ADP’s monthly employment report is released at 8:15 AM ET. Economists expect the report to reveal that 150,000 private payrolls were created in the U.S. economy in April, down from 158,000 in March. The release foreshadows the bigger nonfarm payrolls report due out on Friday.
  • At 8:58 AM, Markit releases its final reading of U.S. manufacturing PMI for the month of April. Economists expect the index to come in at 52.0, matching the flash estimate published earlier this month, but down from March’s 54.9 reading.
  • The ISM Manufacturing index follows at 10 AM. Economists predict the index will moderate to 50.6 from last month’s 51.3 reading, showing further evidence of slowing growth in American manufacturing.
  • Also out at 10 AM are data on construction spending for the month of March. The consensus expectation is that growth in construction spending slowed to 0.6% in March after expanding 1.2% in February.
  • At 2 PM ET, the Federal Reserve announces its latest FOMC monetary policy decision. Observers will be watching closely for any change in the language to acknowledge the recent slowdown in economic indicators, especially those dealing with inflation, which has trended down in recent months. This likely provides impetus for continued quantitative easing.
  • Throughout the day, global automakers will be reporting April sales figures. Analysts predict total vehicle sales were 15.22 million units at a seasonally adjusted annualized rate in April, unchanged from March. Follow all of the data LIVE on Business Insider >
  • BONUS: Runway model Kendra Spears is set to marry Prince Rahim Aga Khan, son of the Imam of the global community of the Shia Ismaili Muslims.


Please follow Money Game on Twitter and Facebook.

Gold Stocks to Rebound in May

Sell in May and don’t go away. Sell and buy gold stocks.

We all know gold stocks have been a disaster for weeks and months. The HUI gold bugs index kept falling below support levels until finding support near 260 which we consider to be very strong support and probably the major low. In the nine trading days since the bottom the gold stocks have recovered only slightly and gradually. However, after Tuesday’s reversal, we see plenty of evidence that augurs for a strong recovery in May.

The gold stocks remain extremely oversold and by several metrics are more oversold now than at the 2008 low. Take a look at the weekly chart below of GDX and specifically the RSI, BPGDM (bullish percent index) and the volume.

apr30edgdx1

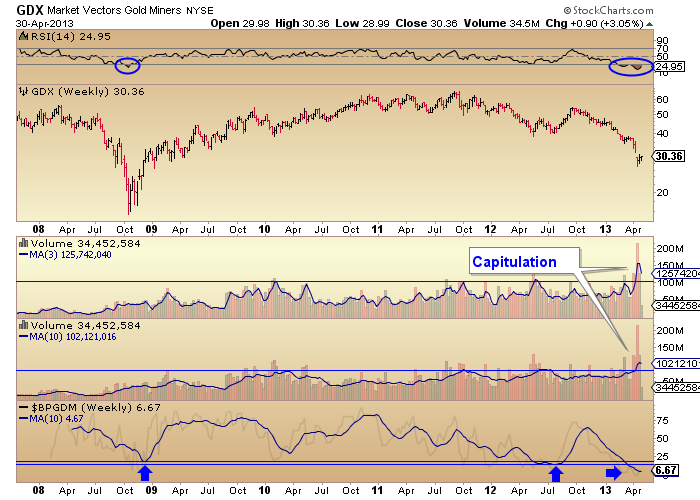
First, we’d note that the weekly RSI in 2008 penetrated below 30 only once and reached a low of 25. In recent months, the RSI penetrated 30, recovered but then fell to a low of 17. It’s currently at 25.

Second, a 10-week moving average of the bullish percent index (a breadth indicator) is currently below 7%. The late 2008 low was 19% while the July 2012 low was 15%. The moving average smooths out the indicator over a longer-term basis and shows how the market has been oversold for quite a while.

Finally, we plot two volume panels and smooth volume out with a 3-week and 10-week moving average. The moving averages show how volume was relatively constant for three years before exploding in recent weeks. The breakout in volume is evidence of capitulation.

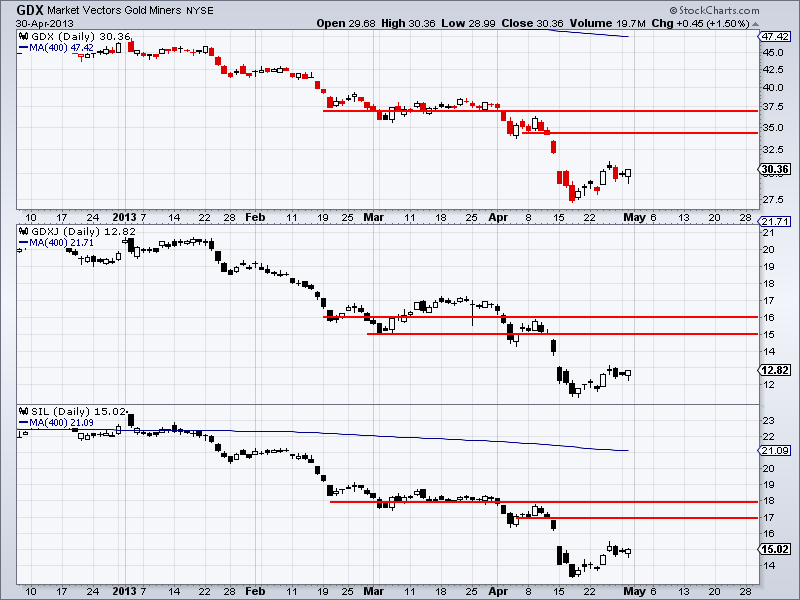
Turning our focus to the short-term, note that the miners have some open gaps which presumably could be filled soon. Below we plot GDX, GDXJ and SIL. GDX has open gaps up to $34 while GDXJ has open gaps up to $15 and SIL has open gaps up to $17. We’ve used the red lines to indicate potential upside targets. Gaps are a signal of an emotional market and given where and when they occurred are a signal of a potential major reversal. If the miners have made a major bottom then the first major resistance would come from the 400-day moving averages.

apr30edgdx2

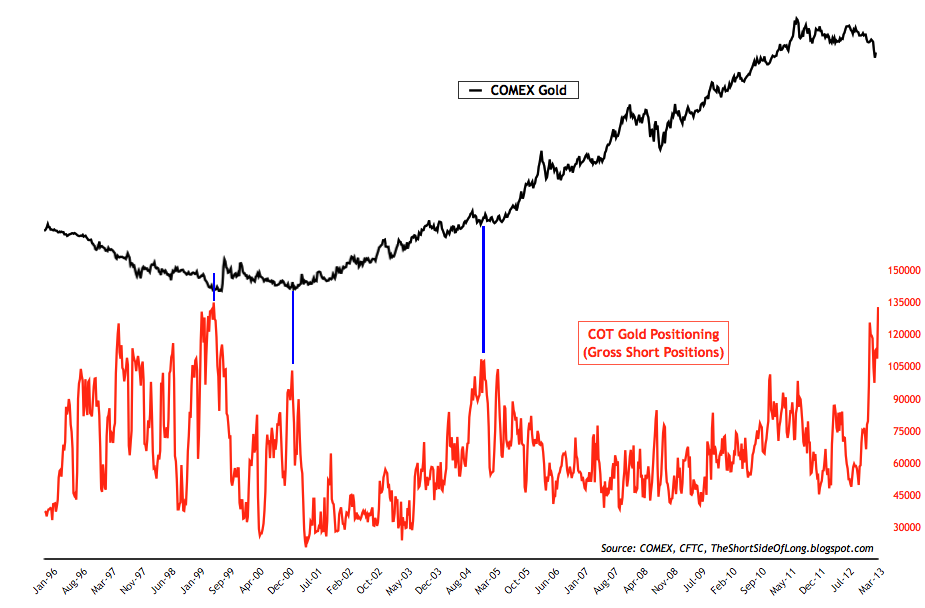
I’m sure you’ve seen plenty of sentiment-related charts showing how bullish this sector looks from a contrarian perspective so I won’t bore you with old information. However, there was an interesting development in the last COT for Gold. As of April 23, with Gold closing around $1410, commercial short positions hit their lowest level since December 2008. Also, non-commercial gross short positions (as per the chart below) surged to a new high, bettering the high of a few weeks ago. Some have likely covered in recent days but there should be more to come as the Gold price has stabilized.


apr30edgoldshorts

In the past week we’ve slowly added more exposure as the evidence is quite compelling. That being said, one should always have an exit strategy or a stop loss of some sort. Looking at GDX, GDXJ and SIL, they have about 10% downside to the recent lows. Long-term players could use those levels as a stop while aggressive traders could use a smaller stop.

We should note that there are much better options than playing the miners ETFs. They help us track the sector but as Rick Rule recently noted, if you buy the sector (specifically GDXJ) you will eventually get killed. Just reference the past four years. While the indices are at the same levels since 2009, many gold and silver companies are trading substantially higher since then. We just completed a 17-page report covering our current four favorite exploration or development companies. If you’d like our analysis on the companies poised to recover now and lead the next bull market, we invite you to learn more about our service.    

Good Luck!

Jordan Roy-Byrne, CMT

Jordan@TheDailyGold.com


The Skeptical Investor – May Update

Produced by McIver Wealth Management Consulting Group

Mark Jasayko, CFA,MBA, Portfolio Manager with McIver Wealth Management of Richardson GMP in Vancouver.

www.McIverWealth.com

test-php-789